Aggregating data values
The Aggregation action ![]() allows you to group values from multiple rows and combine into a single value, producing a new output record set that can be written to a new or existing table. You can:
allows you to group values from multiple rows and combine into a single value, producing a new output record set that can be written to a new or existing table. You can:
- Use table mapping to define relationships between multiple tables that can be used as input.
- Apply a Filter to the input record set or a post-aggregation filter applied to the output record set.
- Group by one or more fields.
- When using an existing table as the output, use field mapping to map output fields to the existing table structure
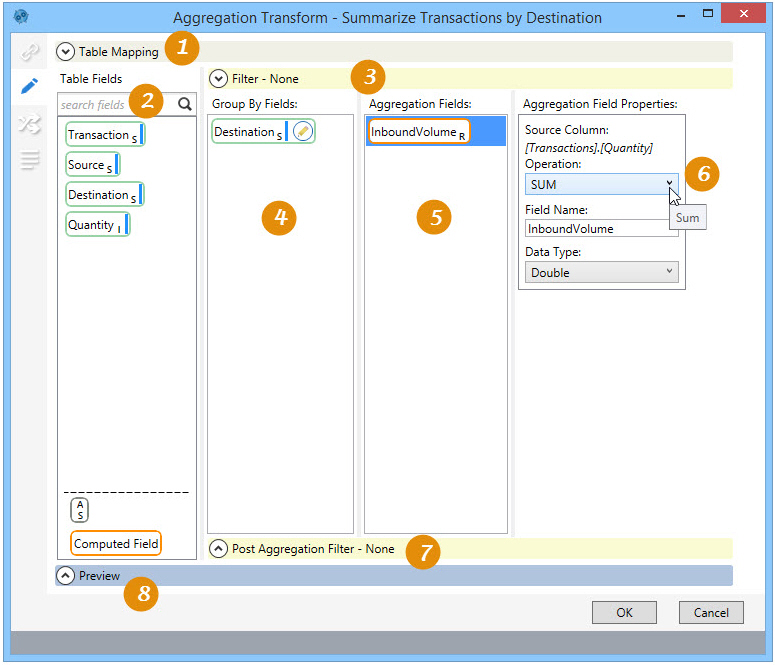
On the Configuration tab:
-
Create mappings when multiple input tables are used.
-
Use Table Fields to create filter, grouping, and aggregation fields.
-
Define filters to limit aggregated records.
-
Define grouping for output.
-
Define fields with values to be aggregated.
-
Set properties of each aggregation field.
-
Define filer to limit aggregation results.
-
Preview data or SQL results.
Possible applications include:
- Transfer data from one database connection to another in an aggregated form.
- Summarize data by time period (e.g., day/week/month/quarter), location, product, or any other column or combination of columns. For example, use Aggregation to create a summary report that displays the total volume shipped from each distribution center over four months of data. This would involve grouping by shipping DC, summing the shipped quantity, and counting the number of shipments.
- Combine records from multiple related tables by defining relationships between the tables.
Aggregate data values from multiple rows
- Drag the Aggregation icon onto the design surface.
-
On the Connections tab
 , enter a Name and a Description to identify the action, then specify the input and output data sources:
Input -
- Database Connection – Select the connection to the database containing the table(s) with data to be aggregated, or choose New Database Connection to establish a new connection to another database containing the table(s).
- Table Name – Use the drop-down to select one or more tables containing the data to be aggregated.
To remove a table from the list of selected tables, highlight the table name, and click the Remove icon
 .
.
Output -
- Database Connection - Select the database of the aggregated table, and then enter or select a Table Name depending on the Output Mode you choose -
- Create/overwrite a table - Enter the name of the table being created or overwritten. Using this mode, you can also choose to -
- Add a new _autokey field to the table, with incremented values that make each table row unique. This is required by some database types.
- Indicate that the table should be deleted after the macro or workflow has executed.
Note that these options affect all output tables for this action.
- Use an existing table - Select the table to be used from the drop-down, and indicate whether the rows in the table should be deleted before the new data is written to the table.
- Create/overwrite a table - Enter the name of the table being created or overwritten. Using this mode, you can also choose to -
- On the Configuration tab
 :
:
- If multiple tables are being used, use the Table Mapping area to define join relationships between the tables. Refer to Table Mapping using joins for more information.
- When using an existing table as the output, use field mapping to map action output fields to the existing table structure. Refer to Field Mapping for additional information.
- Drag the icon for each field being grouped from Table Fields into Group By Fields.
- Drag the icon of each field with values to be aggregated from Table Fields to Aggregation Fields.
- Click on each aggregation field to define its Aggregation Field Properties:
- Operation – Select the type of operation being performed on the data.
- AVG - Returns the average of the values in a group. Null values are ignored.
- CNT - Returns the number of items in a group.
- CNT D - Returns the number of distinct items in a group.
- MAX - Returns the maximum value in the expression.
- MIN - Returns the Minimum value in the expression.
- STDEV - Returns the statistical standard deviation of all values in the specified expression.
- STDEV P - Returns the statistical standard deviation for the population for all values in the specified expression.
- SUM - Returns the sum of all the values, or only the DISTINCT values, in the expression. SUM can be used with numeric columns only.
- VAR - Returns the statistical variance of all values in the specified expression.
- VAR P - Returns the statistical variance for the population for all values in the specified expression.
- Field Name – Enter the name for the aggregated field.
- Data Type – Indicate the type of data being aggregated.
- Operation – Select the type of operation being performed on the data.
- To more narrowly define the conditions by which the action is executed, open the Filter area and build the necessary expression using choices from the Table Fields area or by using the Expression Editor.
- Use the Post Aggregation Filter to narrow the results of your summary to specific rows, such as rows with a total aggregate that exceeds a defined value. The Expression Editor is also available for creating this filter.
- Click Preview to view the data or the SQL statement created from this action. Refer to Preview for information.
- On the Mapping tab
 , map the output fields to an existing table structure when using the existing table for the output. Refer to Field Mapping for more information.
 - If the Performance tab
 is enabled in User Preferences, you can optionally change certain execution settings specific to this action. Refer to Change general preferences for additional information.
Aggregation data example
In the following example, data from multiple sources is aggregated by destination. The Aggregate transform was used to group the Destination column, sum the Quantity column, and create the InboundVolumn column in the new table:

Last modified: Thursday December 19, 2024