What's new
This topic lists new features and enhancements for the Supply Chain 42.0.0 release.
Supply Chain Prescriptions
Current mode added to Mode Switching prescriptions grid
The Prescriptions grid on the Mode Switching page now includes a prescription’s current mode in addition to the prescribed mode. This allows you to compare the current vs. prescribed mode without opening the Prescription Detail view.
Importing mode switching and shipment frequency constraints
You can now import mode switching and shipment frequency constraints using Excel imports, allowing you to add multiple constraints at one time.
App Studio, Macros, and Tracking
App Studio
New Statement Editor functions
The Statement Editor includes new functions for data manipulation. These include new aggregation, mathematical, comparison, date, and string functions.
For more information, see Statement Editor functions.
Aggregation functions:
-
VAR
-
VARZ
-
VARP
-
VARPZ
-
PercentOfSum
Inline functions:
-
Abs
-
DateAdd
-
DateDiff
-
DateName
-
DoesNotEndWith
-
EndsWith
-
Exp
-
IfNull
-
IndexOf
-
InValueRange
-
IsLike
-
IsNotLike
-
IsNotNullAll
-
IsNotNullAny
-
IsNotNullOrEmptyAll
-
IsNotNullOrEmptyAny
-
IsNullAll
-
IsNullAny
-
IsNullOrEmptyAll
-
IsNullOrEmptyAny
-
Ln
-
Log
-
NewID
-
NullIf
-
Pow
-
Sign
-
SubString
-
Trunc
Macros
The Run NextGen NO Model action updates
The Run NextGen NO Model action now uses the default Solving Engine if no selection is made in the Solving Engine configuration setting.
The action also now includes new configuration fields.
-
Solving Engine – This indicates the version of the solving engine to use.
-
Resource Size – This indicates the level of resources to use for the solve.
-
Enhanced
-
Premium
-
Standard
-
For more information, see Design Engines.
Modeler
Platform support for model versions
The Supply Chain platform supports solving models with a database schema of up to one year old. This includes models from releases back to the R40 release (schema version 408000). You must upgrade models with unsupported schemas before solving, modeling, using with apps, or solving on the cloud. The following schema version, and older model schemas, are no longer supported:
-
Release R39 (schema 407000)
Updated solver technology
The underlying technology in the solvers used by Modeler is updated to improve performance. The update to the platform solvers is for all supported model versions (R40, R41, and R42).
Next Generation solvers for Transportation Optimization and Inventory Optimization
Next Generation (Next Gen) solvers, like those previously introduced for Network Optimization, are available for Transportation Optimization and Inventory Optimization. These solvers provide improved performance, “round robin” processing of requests, and the removal of strict limitations on the maximum number of design engines. The solvers offer the same Transportation Optimization and Inventory Optimization technology, with enhanced performance.
The Next Gen solver is selected by default for Inventory Optimization in the Modeler Launch Pad. It will be the default for Transportation Optimization in the next minor release. If you want to run scenarios using the standard design engines, turn off Enable Next Generation Solving Engine.
Cost To Serve enhancements
Cost To Serve Analysis tracks refundable and non-refundable tax, reporting this information in the Cost To Serve Details and Path Summary output tables. You define the taxes in the Taxes and Duties and Tax and Duty Regions input tables.
In addition, there are customer and finished good product summary output tables for Cost To Serve Analysis: Cost To Serve Customer Summary and Cost To Serve Finished Goods Summary.
Production process modeling in Simulation
The Simulation solver supports production process modeling as already supported in Classic Simulation. You define the production processes using the Production Processes, Production Process Steps, and Production Process Assignments input tables. In Production Processes, the only Type supported is "Run Production".
In addition, you can apply business hours to Work Centers and Work Resources using the Entity column in the Business Hours table.
Inventory Optimization termination settings
"Safety Stock Optimization Time Limit (secs)" is available as a termination setting for Inventory Optimization solves. If no value is entered, there is no imposed time limit. In addition, use the "Continue until at least one SSO solution is found" option when you want the solve to continue after the time limit until it finds a solution. These options are available on the Termination Settings tab in Inventory Optimization Options.
Initial map zoom state
When you create a map, the map is centered on 00°00'0.0"N 00°00'0.0"E and zoomed out further than the previous default.
Important notes:
-
Several columns are no longer available in the user interface. These are columns that are not currently in use by a solver. The columns are still defined in the model database tables. Review columns that have a Description of Change value of "Removed from UI (not currently in use)".
-
Please review columns that have a Description of Change value of "Data Type change", "Column removed" or "Change in Required". If you use these columns in a workflow, you may need to adjust the workflow to support the new data type or requirement.
Input Tables
|
Table |
Column |
Description of Change |
Model Database Table Name |
Model Database Column Name |
Data Type |
Required |
|---|---|---|---|---|---|---|
|
Input Tables |
||||||
|
OptionsSnapshot (Table not displayed in the UI) |
ID |
New table/column |
OptionsSnapshot |
ID |
Integer |
Yes |
|
SnapshotID |
New table/column |
OptionsSnapshot |
SnapshotID |
GUID |
Yes |
|
|
Option |
New table/column |
OptionsSnapshot |
Option |
Text |
Yes |
|
|
Value |
New table/column |
OptionsSnapshot |
Value |
Text |
No |
|
|
SnapshotLookup (Table not displayed in the UI) |
ID |
New table/column |
SnapshotLookup |
ID |
Integer |
Yes |
|
SnapshotName |
New table/column |
SnapshotLookup |
SnapshotName |
Text |
Yes |
|
|
SnapshotID |
New table/column |
SnapshotLookup |
SnapshotID |
GUID |
Yes |
|
|
Type |
New table/column |
SnapshotLookup |
Type |
Text |
Yes |
|
Output Tables
|
Table |
Column |
Description of Change |
Model Database Table Name |
Model Database Column Name |
Data Type |
|---|---|---|---|---|---|
|
Output Tables |
|||||
|
Work Center Queue Depth Detail |
Product |
Renamed to Work Center |
SimulationOutputWorkCenterQueueDepthDetail |
WORKCENTER |
Text |
|
Cost To Serve Details |
Refundable Tax |
New column |
OptimizationOutputNetworkPathDetails |
RefundableTax |
Money |
|
Non-Refundable Tax |
New column |
OptimizationOutputNetworkPathDetails |
NonRefundableTax |
Money |
|
|
Path Summary |
Refundable Tax |
New column |
OutputPathsSummary |
RefundableTax |
Money |
|
Non-Refundable Tax |
New column |
OutputPathsSummary |
NonRefundableTax |
Money |
|
|
OptimizationOutputCostAllocation_Lane (Table not displayed in the UI) |
Refundable Tax |
New column (not displayed in the UI) |
OptimizationOutputCostAllocation_Lane |
RefundableTax |
Money |
|
Non-Refundable Tax |
New column (not displayed in the UI) |
OptimizationOutputCostAllocation_Lane |
NonRefundableTax |
Money |
|
|
Cost To Serve Customer Summary |
Customer |
New table/column |
OutputCostToServeCustomerSummary |
CustomerName |
Text |
|
Total Paths |
New table/column |
OutputCostToServeCustomerSummary |
TotalPath |
Float |
|
|
Max Path Length |
New table/column |
OutputCostToServeCustomerSummary |
MaxPathLength |
Float |
|
|
Min Path Length |
New table/column |
OutputCostToServeCustomerSummary |
MinPathLength |
Float |
|
|
Average Path Length |
New table/column |
OutputCostToServeCustomerSummary |
AvgPathLength |
Float |
|
|
Total Revenue |
New table/column |
OutputCostToServeCustomerSummary |
TotalRevenue |
Money |
|
|
Total Cost |
New table/column |
OutputCostToServeCustomerSummary |
TotalCost |
Money |
|
|
Total Profit |
New table/column |
OutputCostToServeCustomerSummary |
TotalProfit |
Money |
|
|
Total Lane Cost |
New table/column |
OutputCostToServeCustomerSummary |
TotalLaneCost |
Money |
|
|
Total Site Cost |
New table/column |
OutputCostToServeCustomerSummary |
TotalSiteCost |
Money |
|
|
Total Site Product Cost |
New table/column |
OutputCostToServeCustomerSummary |
TotalSiteProductCost |
Money |
|
|
Total Other Cost |
New table/column |
OutputCostToServeCustomerSummary |
TotalOtherCost |
Money |
|
|
Total Flow Rate |
New table/column |
OutputCostToServeCustomerSummary |
TotalFlowRate |
Float |
|
|
Total Revenue Rate |
New table/column |
OutputCostToServeCustomerSummary |
TotalRevenueRate |
Float |
|
|
Total Profit Rate |
New table/column |
OutputCostToServeCustomerSummary |
TotalProfitRate |
Float |
|
|
Total Weighted Service Time |
New table/column |
OutputCostToServeCustomerSummary |
TotalWeightedServiceTime |
Float |
|
|
Total Flow Risk |
New table/column |
OutputCostToServeCustomerSummary |
TotalFlowRisk |
Float |
|
|
Total Revenue Risk |
New table/column |
OutputCostToServeCustomerSummary |
TotalRevenueRisk |
Float |
|
|
Total Profit Risk |
New table/column |
OutputCostToServeCustomerSummary |
TotalProfitRisk |
Float |
|
|
Scenario ID |
New table/column |
OutputCostToServeCustomerSummary |
ScenarioID |
Integer |
|
|
Sub-Scenario ID |
New table/column |
OutputCostToServeCustomerSummary |
StepNumber |
Integer |
|
|
Cost To Serve Finished Goods Summary |
Product |
New table/column |
OutputCostToServeFinishedGoodsSummary |
ProductName |
Text |
|
Total Paths |
New table/column |
OutputCostToServeFinishedGoodsSummary |
TotalPath |
Float |
|
|
Max Path Length |
New table/column |
OutputCostToServeFinishedGoodsSummary |
MaxPathLength |
Float |
|
|
Min Path Length |
New table/column |
OutputCostToServeFinishedGoodsSummary |
MinPathLength |
Float |
|
|
Average Path Length |
New table/column |
OutputCostToServeFinishedGoodsSummary |
AvgPathLength |
Float |
|
|
Total Revenue |
New table/column |
OutputCostToServeFinishedGoodsSummary |
TotalRevenue |
Money |
|
|
Total Cost |
New table/column |
OutputCostToServeFinishedGoodsSummary |
TotalCost |
Money |
|
|
Total Profit |
New table/column |
OutputCostToServeFinishedGoodsSummary |
TotalProfit |
Money |
|
|
Total Lane Cost |
New table/column |
OutputCostToServeFinishedGoodsSummary |
TotalLaneCost |
Money |
|
|
Total Site Cost |
New table/column |
OutputCostToServeFinishedGoodsSummary |
TotalSiteCost |
Money |
|
|
Total Site Product Cost |
New table/column |
OutputCostToServeFinishedGoodsSummary |
TotalSiteProductCost |
Money |
|
|
Total Other Cost |
New table/column |
OutputCostToServeFinishedGoodsSummary |
TotalOtherCost |
Money |
|
|
Total Flow Rate |
New table/column |
OutputCostToServeFinishedGoodsSummary |
TotalFlowRate |
Float |
|
|
Total Revenue Rate |
New table/column |
OutputCostToServeFinishedGoodsSummary |
TotalRevenueRate |
Float |
|
|
Total Profit Rate |
New table/column |
OutputCostToServeFinishedGoodsSummary |
TotalProfitRate |
Float |
|
|
Total Weighted Service Time |
New table/column |
OutputCostToServeFinishedGoodsSummary |
TotalWeightedServiceTime |
Float |
|
|
Total Flow Risk |
New table/column |
OutputCostToServeFinishedGoodsSummary |
TotalFlowRisk |
Float |
|
|
Total Revenue Risk |
New table/column |
OutputCostToServeFinishedGoodsSummary |
TotalRevenueRisk |
Float |
|
|
Total Profit Risk |
New table/column |
OutputCostToServeFinishedGoodsSummary |
TotalProfitRisk |
Float |
|
|
Scenario ID |
New table/column |
OutputCostToServeFinishedGoodsSummary |
ScenarioID |
Integer |
|
|
Sub-Scenario ID |
New table/column |
OutputCostToServeFinishedGoodsSummary |
StepNumber |
Integer |
|
Supply Chain Home page
Macros
See What's new in App Studio for information.
Data Visualizations
New ‘Network Flows Dashboard’ template
Data Visualizations now includes a ‘Network Flows Dashboard’ template. This template combines data from Customer Flows and Intersite Flows into a single dashboard.
New Network Optimization tables included in the load script
The Data Visualizations load script includes two new tables for Network Optimization:
-
Cost To Serve Customer Summary
-
Cost To Serve Finished Goods Summary
Workbooks can be refreshed by non-owners
Data Visualizations Designers who are not the owners of a workbook can refresh data in the workbook if it is shared with them.
Adding new worksheet templates to existing workbooks
When you refresh a workbook, any new templates or template updates provided with Data Visualizatios are added to the workbook. If you do not refresh templates the first time you refresh a workbook's data, you will have to wait for the next time the template is updated to receive updates to the template.
Supply Chain API
Future deprecation of name-related endpoints
Supply Chain supports managing assets within a folder structure. If you use the same name for different assets within this folder structure, you can no longer use name-related endpoints because the Supply Chain API cannot identify different assets with the same name in different folders in the system. To avoid this limitation, use ID-related endpoints.
All name-related endpoints in the Supply Chain API will be deprecated in a future release. If you currently use any of these endpoints, you must change to the ID-related endpoints to prevent errors.
Tools such as Excel Add-in, Generic Power BI function, Google Sheets Add-in, and SDK toolkit which were based on name-related endpoints have been updated to use ID-related endpoints. Refer to the Salesforce and Compass articles on these tools to get the latest versions.
For a list of name-related endpoints and their ID-related equivalents, see the Supply Chain API Portal.
New endpoints
The following new endpoints enable you to trigger web solve tasks with the Next Generation (Next Gen) solvers and retrieve related information.
- GET /v5/model-solve/customer/{customerId}/solver-task-specs
Returns a list of TaskVersionResources for the customer.
- GET /v5/model-solve/customer/{customerId}/solver-task-versions/effective
Returns a list of SolverTaskVersions for the customer.
- GET /v5/model-solve/customer/{customerId}/task-version-resources/effective
Returns a list of TaskVersionResources for the customer.
- POST v5/model-solve/model/{modelId}
Triggers a web solve task run.
The following new endpoints enable you to retrieve model queues and related information. You can also cancel a model queue.
- GET /v5/modelqueue/{queueId}
Returns a ModelQueue by its unique identifier.
- PUT /v5/modelqueue/{queueId}/cancel
Cancels a ModelQueue by its unique identifier
- GET /v5/modelqueue/{queueId}/logs
Returns a paginated list of model logs that belong to the given ModelQueue.
- GET /v5/modelqueue/customer/{customerId}
Returns a paginated list of queues that belong to the user's company.
- GET /v5/modelqueue/user/{userId}
Returns a paginated list of queues that belong to the user.
For more information, see the Supply Chain API Portal.
Query import session status and error endpoints by table name
You can now query session status and error information by table name. tableName is a new query parameter for the following endpoints:
- GET /v4/import/session/{sessionId}/status
Returns session status with the given session ID.
- GET /v4/import/session/{sessionId}/error
Returns session errors with the given session ID.
Changes for prior releases
Support for SQL Server 2022
You can upload SQL Server 2022 format databases to llama.ai. These assets work in the various platform applications, such as Modeler and App Studio. When you copy the asset, the copy will be SQL Server 2022, and when you download a SQL Server 2022 asset, it retains the SQL version.
Keep in mind that new assets created on the platform are currently SQL Server 2019.
New Data Flows tool
Modelers require a space and the capability to blend and prepare model data for modeling and apps-based use cases. Data Flows provides a platform-based solution, integrating seamless ETL (extract, transform, and load) functionality with the ability to create and execute end-to-end modeling and app workflows.
Data Flows enable you to link various assets, such as models, user defined databases and decision data models (DDMs), perform data transformations and migrate data between the assets. With a drag and drop interface, you can create repeatable data workflows made up of various actions that interact with your modeling assets.
See Building Data Flows.
SCDP 41.4.0 Transient schema support for Data Flows actions
When creating your data flows, you may have actions that are dependent for their schema upon the results of an upstream action. Data flows provides a “transient schema” which tracks the schema that is yet to be created and makes that available without requiring action execution.
SCDP 41.4.0 Link colors reflect parent-child action relationship
Link colors indicate the relationship between parent and child actions, based on the lookup, input, target, and output properties of each action. Specific combinations of actions and properties result in green links rather than black.
SCDP 41.4.0 Improved delimited file configuration
Configuration for delimited file assets is simplified and enhanced. Click on a column header in the table display to configure an individual column. Multi-column edit enables configuration of any number of columns to set data type and optional format.
SCDP 41.4.0 Action panel display options
You can display the set of Data Flows actions as a list with name and descriptions, a compact list of action names, or a grid with action items.
SCDP 41.2.0View how Data Flows actions use your tables and connections
You can view how your data flow actions use your tables and connections by clicking the Table Summary icon  . This displays a list of list of affected tables and how they are used, as well as a list of database connections. Clicking a table or connection updates the canvas tiles to indicate how each action affects the table or connection.
Tables may be used as follows:
-
Input: the table is used as source data
-
Output: the table is created by the action and data is written to the new table
-
Lookup: the table is used to find data from other tables
-
Target: data is written to the existing table
-
Delete: the table is deleted by the action
See Viewing how tables and connections are used by Data Flows actions.
App Studio
Better file naming for Grid exports
The Grid widget Export feature now names the export file using the grid name and the date and time of the export.
Easier Bulk Updates to columns in grids
When bulk updating a Grid widget column, you can now search the Values field as a searchable dropdown list. The list filters dynamically as you type.
Demand Modeler
Forecast Hub data grid update
The Forecast Hub data table includes a column called Historical Demand/Forecast to indicate whether the data is historical demand or forecasted data.
Setting the day of the week when aggregation occurs
You can set the day of the week on which weekly aggregation occurs using the Day of Aggregation advanced parameter. The default is Mon for Monday. Valid values are Mon, Tue, Wed, Thu, Fri, Sat, Sun.
Filtering the Error Metrics and Causal Analysis grids by columns
You can filter the grids on the Forecast Accuracy page’s Error Metrics grid and the Causal Analysis page’s grid by the following columns.
Error Metrics:
-
Timestamp
-
Model Name
-
Actual
-
Error Avg
-
Absolute Error Avg
-
Squared Error Avg
Causal Analysis:
-
Feature Name
-
Feature Type
-
Correlation Description
-
Lag Number
-
Correlation with Demand
Modeler
SCDP 41.6.0 Display scenario item details from scenarios
In both Scenarios and Rapid Solve Scenarios, turn on the Show Scenario Item Detail toggle to display details about the scenario items. The information includes: the table, filter name, filter criteria, field, and field value(s) with the operator. Details are displayed for both Available Items and Selected Items.
SCDP 41.6.0 Ability to edit scenario items from scenarios
In both Scenarios and Rapid Solve Scenarios, select the arrow on the right of the scenario item or double-click the scenario item to open that item in a tab for editing. You can edit scenario items from the Available Items and the Selected Items lists. If you are editing a rapid eligible scenario item from a Rapid Solve Scenario, the "Show Only Rapid Eligible Tables and Fields" toggle is ON in the scenario item tab.
SCDP 41.3.0 Ability to create scenario items in scenarios
Both the Scenarios and Rapid Solve Scenarios include a New Scenario Item button that lets you create scenario items from within the scenario definition. When you click this button, a new scenario item tab is opened. If you are creating a scenario item from a Rapid Solve Scenario, the "Show Only Rapid Eligible Tables and Fields" toggle is ON and disabled, limiting the selection to rapid eligible tables and fields. New scenario items are added to then end of the Selected Items list and can be reordered as needed.
When you create new scenario items, either from a scenario or in the Scenario Items section of the navigation pane, default values are provided for the table, field, operator, and value, and the scenario item is valid. These values are Product (Table), Status (Field), = (Operator), and Include (Value). When creating a new scenario item from a Rapid Solve Scenario, the default values are Customer Demand (Table), Quantity (Field), * (Operator), and 1 (Value) to ensure rapid eligibility.
SCDP 41.2.0 Additional marker shapes for map point layers
Map markers offer a variety of shapes that you can assign to point layers. The markers, such as stars, triangles, diamonds, and arrows support settings for size, color, borders, and opacity.
SCDP 41.1.0 Enhanced data visualization features in Modeler
Data Visualizations has been moved to the Integrate section of the Modeler navigation bar. You can open visualization workbooks in the Data Visualizations interface or in tabs in the Modeler interface. Workbooks support the same editing features in Modeler tabs as in the Data Visualizations interface. This includes the ability to refresh data in the workbook and to control display of the toolbar and header. In addition, you can duplicate workbooks within the current model or select another model as the target for the duplicated workbook.
Platform support for model versions
The Supply Chain platform supports solving models with a database schema of up to 1 year old. As of the January 2025 release (R41), this includes models from releases back to the R39 release (schema version 407000). Models with unsupported schemas must be upgraded before solving, modeling, using with apps, or solving on the cloud. As of R41, support is ending for the following schema version and older model schemas:
-
Release R38 (schema 406000)
Removal of Modeler Graphs
As part of the transition to the Data Visualizations feature, Coupa removed the Modeler Graphs feature on the Supply Chain platform on January 18, 2025.
This FAQ page in our online Coupa Community provides further information about the discontinuation of Modeler Graphs to address any questions or concerns you may have.
Modeler default for Network Optimization is now the Next Generation solver
When solving using Network Optimization, the default solving engine now uses the Next Generation (Next Gen) solver. Previously, the Next Gen solver was available but not selected by default. This solver provides improved performance for most models and a “round robin” method of processing requests. It currently applies only to Network Optimization.
If you want to use the previous solvers, turn off the “Enable Next Generation Solving Engine” switch in the Modeler Launch Pad before running scenarios.
Rapid Network Explorer
When building scenarios to evaluate changes to your network, long running scenarios can be a challenge to providing results to key stakeholders in a timely manner. The Rapid Network Explorer (RNE) is designed to support small changes, such as adjustments to transportation or production costs, then solving without generating the full model again. This significantly reduces the time to return results, allowing you to explore a number of changes in a short period of time.
Run Network Optimization on a scenario to be used as the base data for RNE. You then define rapid scenarios, with items that adjust specific RNE eligible columns, such as demand quantity and variable transportation cost. When you run the Rapid Solve problem type, the items in the rapid scenario are applied to the base scenario results and output is returned to the model.
The RNE Intensity option lets you control the extent to which decision variables in the base scenario are fixed when running the rapid solve. A higher value means more decision variables are constrained, leading to a quicker solution. A lower value opens up the base data by not constraining as many decision variables.
Optimize networks to minimize risk level
When you populate Risk Profiles in your model, Network Optimization outputs a composite risk score for the sites in the network. However, this risk score does not affect the optimization results. In this release, you can use risk as a constraint and as an objective for Network Optimization. Updates to input tables, sequential objectives, constraints, and parameters enable Network Optimization to minimize risk and respect maximum risk levels.
You can define a Maximum Risk constraint value per product in the Products table. The product risk is the weighted average of the product flow through the sites based on each site’s risk score. The site risk score is based on the weighted average of user-entered scores in the Risk Profile table when a Risk Profile is assigned to a site. You can also constrain risk at the network level with the Maximum Network Risk option in Network Optimization Options.
To apply risk as part of the objective, create one or more Sequential Objective records targeting the new risk-based objectives, then run Sequential Optimization:
-
Total Network Risk
-
Maximum Network Risk
-
Maximum Product Risk
New output tables and columns report the aggregated risk scores and provide percentage summaries of high, moderate, and low risk flows in the solution.
See Risk analysis and minimizing risk.
Changes to scores in Risk Profiles
The four Custom Score columns in the Risk Profiles table are now evaluated on a scale of 0 to 100 where higher scores signify higher risk. Previously, a high score signified a low risk.
Cost To Serve features
Additional columns are available in cost to serve-related output tables. The Site Variable Cost and Space Expansion Cost are now included in the Network Path Details and Path Summary output tables.
Space Expansion Cost is also included as an input when running Cost To Serve Analysis.
New configuration parameters have been added for Cost To Serve Analysis:
-
CTSFilter_TopProdsByCostPercentage - The final products are ranked by the cost related to them, then the percentage entered for this parameter is used to select the top x products. Cost To Serve Analysis is run on this smaller set of products, resulting in fewer paths in the output. The value is between 0 and 1.
-
CTSFilter_TopProdsByProfitPercentage - The final products are ranked by the profit related to them, then the percentage entered for this parameter is used to select the top x products. Cost To Serve Analysis is run on this smaller set of products, resulting in fewer paths in the output. The value is between 0 and 1.
Populate these parameters in the Config_NO table and set the Status to “Include” to use them in Cost To Serve Analysis.
Network Optimization dynamic termination settings
Network Optimization supports dynamic termination settings, enabling you to stop a solve based on settings such as the maximum time since the last solution was found, the maximum percent of memory consumed by the solve, and others. These settings support better tuning of solve terminations.
The settings are available on the Termination Settings tab in Network Optimization Options:
-
Maximum Time Since Last Solution – Stops the model after no better solution has been found for the time entered (in seconds).
-
Maximum Time Since Last Improvement – Stops the model after no better gap has been found for the time entered (in seconds).
-
Dynamic Percent Gap - Allows the termination percent gap to change over the solving process. Define a two-step function where the first value in each pair is the run time (in seconds) and the second is the gap percentage.
-
Dynamic Absolute Gap - Allows the termination percent gap to change over the solving process. Define a two-step function where the first value in each pair is the run time (in seconds) and the second is the absolute gap.
-
Max Memory Consumption Percent - Forces the solve to stop after system memory consumption reaches the percentage defined by the limit.
Bing support in Transit Matrix Calculate Paths
Bing is supported as the default provider when you Calculate Paths in the Transit Matrix table. When using Bing, you also have the option to “Avoid Ferry Route Calculation If Possible”. When this option is selected, Bing seeks routes that do not use ferries.
Display list of visualizations associated with a model
Data Visualizations now supports three workbooks per model asset. In Modeler, when you select Data Visualizations, workbooks that are currently defined for the model are displayed in the Data Visualization pane. To open a workbook, click on the name – the workbook is opened in Data Visualizations in a new browser tab.
Click New Workbook to create a new workbook for the model.
NO – IO Conversion and Model Expansion support solver selection
The two model transformations, NO – IO Conversion and Model Expansion, now provide solving engine selection when the model is run. This enables you to use more powerful solving engines for complex, memory intensive models.
Important notes:
-
Several columns are no longer available in the user interface. These are columns that are not currently in use by a solver. The columns are still defined in the model database tables. Review columns that have a Description of Change value of "Removed from UI (not currently in use)".
-
Please review columns that have a Description of Change value of "Data Type change", "Column removed" or "Change in Required". If you use these columns in a workflow, you may need to adjust the workflow to support the new data type or requirement.
Input Tables
|
Table |
Column |
Description of Change |
Model Database Table Name |
Model Database Column Name |
Data Type |
Required |
|---|---|---|---|---|---|---|
|
Input Tables |
||||||
|
Products |
Maximum Risk |
New column |
Products |
MaximumRisk |
Float |
No |
|
Work Centers |
Shift Pattern |
Removed from UI (not currently in use) |
WorkCenters |
ShiftPattern |
Text |
No |
|
Work Resources |
Shift Pattern |
Removed from UI (not currently in use) |
WorkResources |
ShiftPattern |
Text |
No |
|
Work Resources |
Fixed Resource Cost |
Data Type change |
WorkResources |
UnitFixedCost |
Text |
No |
|
Work Resources Multi-Period |
Fixed Resource Cost |
Data Type change |
WorkResources_MultiPeriod |
UnitFixedCost |
Text |
No |
|
Sequential Objectives |
Other |
Removed from UI (not currently in use) |
SequentialObjectives |
Other |
Text |
No |
|
Scenarios |
Classification |
New column (not displayed in the UI) |
Scenarios |
Classification |
Text |
Yes |
Output Tables
|
Table |
Column |
Description of Change |
Model Database Table Name |
Model Database Column Name |
Data Type |
|---|---|---|---|---|---|
|
Output Tables |
|||||
|
Network Summary |
Aggregated Risk Score |
New column |
OptimizationOutputNetworkSummary |
AggregatedRiskScore |
Float |
|
Risk Profile Summary (The Risk Summary table has been renamed in the UI to Risk Profile Summary.) |
Aggregated Risk Score |
New column |
OptimizationOutputSupplierRiskSummary |
AggregatedRiskScore |
Float |
|
Site Risk Summary |
Aggregated Risk Score |
New column |
OptimizationOutputSiteRiskSummary |
AggregatedRiskScore |
Float |
|
Site Product Risk Summary |
Aggregated Risk Score |
New column |
OptimizationOutputProductRiskSummary |
AggregatedRiskScore |
Float |
|
Path Summary |
Site Variable Cost |
New column |
OutputPathsSummary |
SiteVariableCost |
Money |
|
Space Expansion Cost |
New column |
OutputPathsSummary |
SpaceExpansionCost |
Money |
|
|
Cost To Serve Details |
Site Variable Cost |
New column |
OptimizationOutputNetworkPathsDetails |
SiteVariableCost |
Money |
|
Space Expansion Cost |
New column |
OptimizationOutputNetworkPathsDetails |
SpaceExpansionCost |
Money |
|
|
Backend table for Cost To Serve Analysis (not displayed in the UI) |
Space Expansion Cost (not displayed in UI) |
New column |
OptimizationOutputCostAllocation_Site |
SpaceExpansionCost |
Money |
|
Network Risk Summary |
Aggregated Risk Score |
New table/column |
NetworkRiskSummary |
AggregatedRiskScore |
Float |
|
Percentage Low Risk |
New table/column |
NetworkRiskSummary |
PercentageLowRisk |
Float |
|
|
Percentage Moderate Risk |
New table/column |
NetworkRiskSummary |
PercentageModerateRisk |
Float |
|
|
Percentage High Risk |
New table/column |
NetworkRiskSummary |
PercentageHighRisk |
Float |
|
|
Scenario ID |
New table/column |
NetworkRiskSummary |
ScenarioID |
Integer |
|
|
Sub-Scenario ID |
New table/column |
NetworkRiskSummary |
StepNumber |
Integer |
|
|
Product Risk Summary |
Product |
New table/column |
ProductRiskSummary |
ProductName |
Text |
|
Aggregated Risk Score |
New table/column |
ProductRiskSummary |
AggregatedRiskScore |
Float |
|
|
Percentage Low Risk |
New table/column |
ProductRiskSummary |
PercentageLowRisk |
Float |
|
|
Percentage Moderate Risk |
New table/column |
ProductRiskSummary |
PercentageModerateRisk |
Float |
|
|
Percentage High Risk |
New table/column |
ProductRiskSummary |
PercentageHighRisk |
Float |
|
|
Scenario ID |
New table/column |
ProductRiskSummary |
ScenarioID |
Integer |
|
|
Sub-Scenario ID |
New table/column |
ProductRiskSummary |
StepNumber |
Integer |
|
Optional solver parameter changes
This table lists parameters that have been added to the Advanced Parameter Tables for the various technologies:
|
Technology |
Parameter Name |
Description of Change |
Parameter Value |
Parameter Description |
|---|---|---|---|---|
|
Network Optimization |
CTSFilter_TopProdsByCostPercentage |
New parameter, |
Between 0 and 1 |
The final products are ranked by the cost related to them, then the percentage entered for this parameter is used to select the top x products. Cost To Serve Analysis is run on this smaller set of products, resulting in fewer paths in the output. |
|
Network Optimization |
CTSFilter_TopProdsByProfitPercentage |
New parameter, |
Between 0 and 1 |
The final products are ranked by the profit related to them, then the percentage entered for this parameter is used to select the top x products. Cost To Serve Analysis is run on this smaller set of products, resulting in fewer paths in the output. |
|
Network Optimization |
Risk_Formulation_Basis |
New parameter, |
One of: |
Set this parameter to "Revenue" if you want to multiply revenue with the risk score as the risk term in the objective, otherwise set it to "Flow" to multiply the throughput with the risk score. |
Supply Chain Home Page
Data Visualizations
SCDP 41.1.0Hide the Qlik toolbar and header
To increase the available space for widgets on Data Visualizations sheets, the Qlik toolbar and header can be hidden when needed. Two new toggle buttons, Hide/Show Toolbar and Hide/Show Header, control the toolbar and header display.
Multiple workbooks per database asset
Data Visualizations now supports up to three workbooks associated with a Supply Chain Guru model. This allows you to create a separate workbook for each of the technology types (Network Optimization, Inventory Optimization, and Transportation Optimization). You can, however, use the three available workbooks in any combination necessary. Workbooks are limited to three per model, not per technology type. As an example, you might have two Network Optimization workbooks and one Transportation Optimization workbook.
When you open Data Visualizations while working with a model in Modeler, you can choose which workbook you want to open if more than one workbook is associated with the model.
Notifying users of Qlik maintenance windows
Data Visualizations now includes banner notifications to announce events such as Qlik maintenance windows. The notifications appear at the top of the Data Visualizations home page as a banner. You can dismiss banners, with the exception of System Unavailable messages. During Qlik maintenance windows, workbooks are not available.
Greenfield summary tables added
The Greenfield summary tables have been added to the load script. These tables are:
-
Greenfield Flows
-
Greenfield Service Summary
-
Greenfield Sites
-
Greenfield Sites Summary
-
Greenfield Summary
These tables are available with the Network Optimization and Inventory Optimization templates, including the new Greenfield Flows Dashboard template.
New worksheet templates
Data Visualizations now include the following standard templates. You can use these templates to quickly create customized worksheets in your Data Visualizations workbooks.
-
Greenfield Flows Dashboard
-
Cost to Serve Analysis
-
Production Dashboard
-
Production Summary Comparison
-
Inventory Summary Comparison — update to existing template
Grouped templates in the Public Sheets section
The worksheet templates are now grouped in the Public Sheets section in order to make them easier to find. The groups are:
NO Single Scenario Templates
-
Network Summary Dashboard
-
Customer Flows Dashboard
-
Intersite Flows Dashboard
-
Production Flows Dashboard
NO Comparison Templates
-
Network Summary Comparison
-
Customer Flows Comparison
-
Intersite Flows Comparison
-
Production Flows Comparison
IO Demand Templates
-
Customer Demand Report
-
Site Demand Report
Inventory Optimization - Inventory Policy/Summary Templates
-
Inventory Summary Comparison
-
Inventory Policy Overview
-
Inventory Policy Details
Production
-
Production Summary Comparison
-
Multi-Period Production Dashboard
Greenfield
-
Greenfield Flows Dashboard
Cost to Serve
-
Cost to Serve Analysis
Grouping workbooks on the home page
On the Data Visualizations home page, you can now create groupings for your Private sheets to make them easier to find. Once you have grouped your Private sheets, you can make the group public if necessary.
Demand Modeler
Purging old scenario runs
In order to maintain database efficiency, Demand Modeler automatically deletes data from scenario runs older than the last successfully completed run. The latest scenario run for each scenario will be preserved.
Output Reports for Explainable AI
The Correlation Analysis tab of Demand Modeler has been renamed to Causal Analysis, and a new Variable Importance sub-tab has been added. These changes help modelers discover the top causals that are influencing the forecast. For every time series chosen by the modeler in the Demand Modeler filters, the new Causal Influence bar chart on the Variable Importance sub-tab displays the top causals that are influencing the forecast, in decreasing order of influence. A detail table below the chart displays the corresponding details for the chart.
For more information on Coupa AI, see AI Trust Center and Coupa Artificial Intelligence Features.
App Studio
Updating apps in production using draft apps
You can now update an existing App Studio app using a draft copy of the app, rather than updating the live app. A draft copy of an app is an exact copy of an app that is inaccessible to app users, which an app designer can use to make and test changes safely without affecting the live version of the app. All assets for the app (app boards, widgets, user defined databases, dynamic views, and sessions) except the Decision Data Model (DDM) are copied, and the draft app only uses the copies. The draft app will reference the live DDM.
For example, you can:
- Make changes to app boards such as adding or changing widgets
- Add or remove app boards
- Add columns and tables to the database
When the changes are finalized in the live app, the draft app is archived and the database for the draft is deleted.
The database copy limit is 20 GB. If the database is larger than 20 GB, the schema of the database is copied, instead.
If you are interested in this feature, please contact Coupa Support for access.
Copying databases larger than 20GB
You can now copy databases whose sizes are greater than or equal to 20GB.
Data Grid Improvements
You can now copy values from a Grid or Pivot Grid widget regardless of the editability conditions of a particular column. Values can be copied from a single cell across data grids and pivot grids.
A new Clear All Filters button is available on the Grid widget toolbar. When you click Clear All Filters, all active filters in the data grid are removed.
Modeler
Platform support for model versions
The Supply Chain platform supports solving models with a database schema of up to 1 year old. As of the September 2024 release (R40), this includes models from releases back to the R38 release (schema version 406000). Models with unsupported schemas must be upgraded prior to solving, modeling, using with apps or solving on the cloud. As of R40, support is ending for the following schema version, as well as older model schemas:
-
Release R37 (schema 405000)
Next generation solver for Network Optimization
As Coupa continues to innovate and deliver faster solutions to our customers, Network Optimization now offers a next generation (Next Gen) deployment of the solver as an option when running models in Modeler. The Next Gen solver offers the same Network Optimization technology, with improvements to the processing of models.
Benefits of the Next Gen solver include:
-
Improved performance – In many cases, models solve faster with the Next Gen solver than the previous solver. This may not affect models that already run quickly but is more evident with longer running models.
-
“Round Robin” processing of requests – The Next Gen solver will loop through requests by customer. This prevents cases where a customer sends a large number of requests that effectively block the next customer’s requests from starting right away. The solver executes a request from the first customer, then moves on to the next customer and executes a request. This continues for all customers in the queue. Once it has been through all customers, it loops back to the first customer and will continue to take requests in this manner as long as there is available memory and CPU. As resources are freed up, it processes additional requests.
-
Removal of strict limitation on the maximum number of design engines – The Next Gen solver will not have the same cap of the available number of design engines that can be accessed at one time. As a result, the Next Gen solver can scale more effectively than the previous solver when large numbers of requests are made.
Transit Matrix route calculation
The Transit Matrix provides a way to use accurate road distance and travel time values when solving your model. You can now generate source-destination connections in the Transit Matrix table in Modeler using either Transportation Policies or Site and Customer locations. Filters let you control which connections are generated. Once the Transit Matrix table has been populated, you can then use Straight Line Plus Circuity to calculate the Distance and Travel Time on the route.
Cost To Serve updates
New output tables provide additional information pertaining to the enhanced Cost To Serve Analysis. The Cost To Serve Network Summary gives scenario-level metrics about the paths created by Cost To Serve, including path lengths, costs, revenue, and profit values. The Path Summary has path-level details, including many cost metrics, revenue, and profit values.
Sequential Objectives for spatial modeling
A set of objectives is available in the Sequential Objectives table for use with spatial modeling:
-
Maximum Site Expansion
-
Minimum Site Expansion
-
Maximum Storage Space Expansion
-
Minimum Storage Space Expansion
-
Maximum Shipping Space Expansion
-
Minimum Shipping Space Expansion
In support of these objectives, Storage Space and Shipping Space columns have been added to the Sequential Objectives table.
Multi-stop dock door scheduling
Dock door scheduling is now supported for multiple stops on a route. The previous limitation that a dock door is applied only to one stop on a route has been removed. New columns in the Customers table also let you define the Number of Dock Doors and Dock Door Reset Time at customer locations. Transportation Optimization considers these constraints and assigns docks doors on the route for both site and customer stops.
The new Dock Door Assignment output table summarizes dock door use at site and customer locations for each route.
Improved model upload
When you use the upload feature in Modeler ![]() , you see the Data Management Upload feature in a new browser tab. This feature provides improved visibility, control, and performance during file uploads. In addition, you can now upload multiple assets at one time and track their progress.
, you see the Data Management Upload feature in a new browser tab. This feature provides improved visibility, control, and performance during file uploads. In addition, you can now upload multiple assets at one time and track their progress.
When selecting the file to upload, you can optionally change the name for the uploaded asset.
Data Management displays a progress link above the assets table. Click the link to review all uploads currently in progress. If needed, you can pause the upload and resume at a later time. When resumed, the upload continues from the point where it was paused, rather than requiring a new upload.
Data Visualizations support for Inventory Optimization and Transportation Optimization
When creating a workbook for Data Visualizations, you select the Technology Type to be used. This is one of: Network / Inventory Optimization or Transportation Optimization. The visualizations load script includes the correct tables for the selected Technology Type.
Important notes:
-
This table was added to the model database schema in a previous release. It has been exposed in the user interface for this release: Rapid Network Explorer Summary.
-
Please review columns that have a Description of Change value of "Data Type change", "Column removed" or "Change in Required". If you use these columns in a workflow, you may need to adjust the workflow to support the new data type or requirement.
Input Tables
|
Table |
Column |
Description of Change |
Model Database Table Name |
Model Database Column Name |
Data Type |
Required |
|---|---|---|---|---|---|---|
|
Input Tables |
||||||
|
Customers
|
Number of Dock Doors |
New column |
Customers |
NumberOfDockDoors |
Integer |
No |
|
Dock Door Reset Time |
New column |
Customers |
DockDoorResetTime |
Text |
No |
|
|
Sequential Objectives
|
Storage Space |
New column |
SequentialObjectives |
StorageSpaceName |
Text |
No |
|
Shipping Space |
New column |
SequentialObjectives |
ShippingSpaceName |
Text |
No |
|
Output Tables
|
Table |
Column |
Description of Change |
Model Database Table Name |
Model Database Column Name |
Data Type |
|---|---|---|---|---|---|
|
Output Tables |
|||||
|
Network Summary |
Solver Termination Condition |
New column |
OptimizationOutputNetworkSummary |
SolverTerminationCondition |
Text |
|
Cost To Serve Network Summary
|
Run Time |
New table/column |
OutputCostToServeSummary |
RunTime |
Text |
|
Peak Memory Usage |
New table/column |
OutputCostToServeSummary |
PeakMemoryUsage |
Text |
|
|
Total Paths |
New table/column |
OutputCostToServeSummary |
TotalPath |
Integer |
|
|
Total Reported Paths |
New table/column |
OutputCostToServeSummary |
TotalReportedPath |
Integer |
|
|
Total Cross Period Paths |
New table/column |
OutputCostToServeSummary |
TotalCrossPeriodPath |
Integer |
|
|
Max Path Length |
New table/column |
OutputCostToServeSummary |
MaxPathLength |
Integer |
|
|
Min Path Length |
New table/column |
OutputCostToServeSummary |
MinPathLength |
Integer |
|
|
Average Path Length |
New table/column |
OutputCostToServeSummary |
AveragePathLength |
Float |
|
|
Total Revenue |
New table/column |
OutputCostToServeSummary |
TotalRevenue |
Money |
|
|
Total Cost |
New table/column |
OutputCostToServeSummary |
TotalCost |
Money |
|
|
Total Profit |
New table/column |
OutputCostToServeSummary |
TotalProfit |
Money |
|
|
Total Lane Cost |
New table/column |
OutputCostToServeSummary |
TotalLaneCost |
Money |
|
|
Total Site Cost |
New table/column |
OutputCostToServeSummary |
TotalSiteCost |
Money |
|
|
Total Site Product Cost |
New table/column |
OutputCostToServeSummary |
TotalSiteProductCost |
Money |
|
|
Total Other Cost |
New table/column |
OutputCostToServeSummary |
TotalOtherCost |
Money |
|
|
Total Flow Rate |
New table/column |
OutputCostToServeSummary |
TotalFlowRate |
Float |
|
|
Total Revenue Rate |
New table/column |
OutputCostToServeSummary |
TotalRevenueRate |
Float |
|
|
Total Profit Rate |
New table/column |
OutputCostToServeSummary |
TotaProfitRate |
Float |
|
|
Total Weighted Service Time |
New table/column |
OutputCostToServeSummary |
TotalWeightedServiceTime |
Float |
|
|
Scenario ID |
New table/column |
OutputCostToServeSummary |
ScenarioID |
Integer |
|
|
Sub-Scenario ID |
New table/column |
OutputCostToServeSummary |
StepNumber |
Integer |
|
|
Path Summary
|
Path ID |
New table/column |
OutputPathsSummary |
PathID |
Integer |
|
Start Product |
New table/column |
OutputPathsSummary |
StartProduct |
Text |
|
|
Finished Good |
New table/column |
OutputPathsSummary |
FinishedGood |
Text |
|
|
Start Site |
New table/column |
OutputPathsSummary |
StartSite |
Text |
|
|
Customer Name |
New table/column |
OutputPathsSummary |
CustomerName |
Text |
|
|
Start Period |
New table/column |
OutputPathsSummary |
StartPeriodName |
Text |
|
|
Start Period Number |
New table/column |
OutputPathsSummary |
StartPeriodNumber |
Integer |
|
|
End Period |
New table/column |
OutputPathsSummary |
EndPeriodName |
Text |
|
|
End Period Number |
New table/column |
OutputPathsSummary |
EndPeriodNumber |
Integer |
|
|
Demand Qty |
New table/column |
OutputPathsSummary |
DemandQty |
Float |
|
|
Flow Unit Qty |
New table/column |
OutputPathsSummary |
FlowUnitQty |
Float |
|
|
Total Cost |
New table/column |
OutputPathsSummary |
TotalCost |
Money |
|
|
Other Cost |
New table/column |
OutputPathsSummary |
OtherCost |
Money |
|
|
Fixed Startup Cost |
New table/column |
OutputPathsSummary |
FixedStartupCost |
Money |
|
|
Fixed Operating Cost |
New table/column |
OutputPathsSummary |
FixedOperatingCost |
Money |
|
|
Closing Cost |
New table/column |
OutputPathsSummary |
ClosingCost |
Money |
|
|
Production Cost |
New table/column |
OutputPathsSummary |
ProductionCost |
Money |
|
|
Transportation Cost |
New table/column |
OutputPathsSummary |
TransportationCost |
Money |
|
|
Facility Inventory Holding Cost |
New table/column |
OutputPathsSummary |
FacilityInventoryHoldingCost |
Money |
|
|
Intransit Inventory Holding Cost |
New table/column |
OutputPathsSummary |
IntransitInventoryHoldingCost |
Money |
|
|
Sourcing Cost |
New table/column |
OutputPathsSummary |
SourcingCost |
Money |
|
|
Inbound Warehousing Cost |
New table/column |
OutputPathsSummary |
InboundWarehousingCost |
Money |
|
|
Outbound Warehousing Cost |
New table/column |
OutputPathsSummary |
OutboundWarehousingCost |
Money |
|
|
Capital Investment |
New table/column |
OutputPathsSummary |
CapitalInvestment |
Money |
|
|
Facility CO2 Cost |
New table/column |
OutputPathsSummary |
FacilityCO2Cost |
Money |
|
|
Transportation CO2 Cost |
New table/column |
OutputPathsSummary |
TransportationCO2Cost |
Money |
|
|
Work Resources Cost |
New table/column |
OutputPathsSummary |
WorkResourcesCost |
Money |
|
|
Duty Cost |
New table/column |
OutputPathsSummary |
DutyCost |
Money |
|
|
Demand Penalty |
New table/column |
OutputPathsSummary |
DemandPenalty |
Money |
|
|
Service Distance |
New table/column |
OutputPathsSummary |
ServiceDistance |
Float |
|
|
Service Hours |
New table/column |
OutputPathsSummary |
ServiceHours |
Float |
|
|
Revenue |
New table/column |
OutputPathsSummary |
Revenue |
Money |
|
|
Value |
New table/column |
OutputPathsSummary |
Value |
Money |
|
|
Profit |
New table/column |
OutputPathsSummary |
Profit |
Money |
|
|
Revenue Rate |
New table/column |
OutputPathsSummary |
RevenueRate |
Float |
|
|
Profit Rate |
New table/column |
OutputPathsSummary |
ProfitRate |
Float |
|
|
Scenario ID |
New table/column |
OutputPathsSummary |
ScenarioID |
Integer |
|
|
Sub-Scenario ID |
New table/column |
OutputPathsSummary |
StepNumber |
Integer |
|
|
Constraint Summary
|
Storage Space |
New column |
OptimizationOutputConstraintSummary |
StorageSpaceName |
Text |
|
Shipping Space |
New column |
OptimizationOutputConstraintSummary |
ShippingSpaceName |
Text |
|
|
Route Summary
|
Dock Door ID |
Column removed (now included in Dock Door Assignment table) |
VRPOutputRoutes |
DockDoorId |
Text |
|
Dock Door Start Time |
Column removed (now included in Dock Door Assignment table) |
VRPOutputRoutes |
DockDoorStartTime |
DateTime |
|
|
Dock Door End Time |
Column removed (now included in Dock Door Assignment table) |
VRPOutputRoutes |
DockDoorEndTime |
DateTime |
|
|
Dock Door Assignment
|
Asset Name |
New table/column |
VRPDockDoorAssignment |
AssetName |
Text |
|
Asset ID |
New table/column |
VRPDockDoorAssignment |
AssetID |
Text |
|
|
Route ID |
New table/column |
VRPDockDoorAssignment |
RouteID |
Text |
|
|
Site Name |
New table/column |
VRPDockDoorAssignment |
SiteName |
Text |
|
|
Dock Door ID |
New table/column |
VRPDockDoorAssignment |
DockDoorID |
Text |
|
|
Dock Door Start Time |
New table/column |
VRPDockDoorAssignment |
DockDoorStartTime |
DateTime |
|
|
Dock Door End Time |
New table/column |
VRPDockDoorAssignment |
DockDoorEndTime |
DateTime |
|
|
Scenario ID |
New table/column |
VRPDockDoorAssignment |
ScenarioID |
Integer |
|
|
Sub-Scenario ID |
New table/column |
VRPDockDoorAssignment |
StepNumber |
Integer |
|
Optional solver parameter changes
This table lists parameters that have been added to the Advanced Parameter Tables for the various technologies:
|
Technology |
Parameter Name |
Description of Change |
Parameter Value |
Parameter Description |
|---|---|---|---|---|
|
Network Optimization |
MaxTimeSinceLastSolution |
New parameter |
3600 |
Adds additional termination criteria to stop model after no better solution has been found for a period of time (in seconds). |
|
Network Optimization |
MaxTimeSinceLastImprovement |
New parameter |
7200 |
Adds additional termination criteria to stop model after no better gap has been found for a period of time (in seconds). |
|
Network Optimization |
DynamicPercentGap |
New parameter |
0.01,3600|0.1,7200 |
Allows the termination percent gap to change over the solving process based on solve time breaks (in seconds). |
|
Network Optimization |
DynamicAbsoluteGap |
New parameter |
1000000,3600|2000000,7200 |
Allows the termination absolute gap to change over the solving process based on solve time breaks (in seconds). |
|
Network Optimization |
MaxMemoryConsumptionPercent |
New parameter |
95 |
Max system memory to leverage in percent, will force a stop after memory consumption reaches the limit. |
Data Visualizations
Load script enhancements
The Visualizations load script now includes Transportation Optimization tables, allowing users to build visualizations from their Transportation Optimization data model.
The Data Visualizations load script now includes additional templates for you to use to create dashboards. The following templates have been added:
Network and Inventory Optimization templates
-
An Inventory Summary Comparison template provides a comparison of inventory costs and policy parameters that can be used to evaluate the performance of the selected scenarios.
-
A Customer Demand Report template provides demand by product, customer and class, and allows you to review customer demand time series.
-
A Site Demand Report template provides demand by product and site, and allows you to review site demand time series.
-
An Inventory Policy Overview template enables you to review recommended inventory policies such as coverage, safety stocks, etc. from different perspectives.
-
An Inventory Policy Details template provides an understanding of the calculation of service times. You can apply filters to zoom in for the details of specific sites/products.
Transportation Optimization templates
-
A Transportation Summary Comparison template provides an overview of route costs and utilization across different scenarios.
-
A Routes Details template reflects the various activities that occur during a route, along with the total distance, cost, drive time and utilization.
-
A Shipments Output Dashboard template provides a map of shipments for the selected date range, an overview of shipment status and routed shipments by day.
Landing page enhancements
The Data Visualizations home page grid now allows column filtering and sorting. This will help you find your workbooks.
Support for User Defined Databases (UDDBs)
You can now create Data Visualizations workbooks for your UDDBs on the platform. This includes:
-
Creating a new workbook using a UDDB that has been uploaded to the platform
-
Adding tables to existing workbooks that use a UDDB as the data asset
-
Removing tables to existing workbooks that use a UDDB as the data asset
-
When tables are added or removed from the UDDB outside of Data Visualizations, the changes are reflected in your workbook
Supply Chain Home
User Settings
SCDP 40.3.0 Additional email notification option
An option has been added to the Platform category in Email Notifications. The "Database Ready alert" can be used to opt out of email notifications that are generated by database creation in macros, such as solving using a private session.
Email Notifications
Some email notifications from the Supply Chain platform offer an Unsubscribe option. If you want to opt out of receiving notifications for the specific action, click Unsubscribe. The Email Notifications tab in the platform User Settings is opened and the alert is automatically unchecked and saved.
Data Management
Improved asset upload
When you upload an asset or replace an existing asset in Data Management, an improved upload feature is used. This feature provides better visibility, control, and performance during file uploads. In addition, you can now upload multiple assets at one time and track their progress.
Data Management displays a progress link above the assets table. Click the link to review all uploads currently in progress. If needed, you can pause the upload and resume at a later time. When resumed, the upload continues from the point where it was paused, rather than requiring a new upload.
Supply Chain Platform Support
SQL Server 2014 Support
Microsoft will no longer be supporting SQL Server 2014 as of July 9th, 2024. In light of this, llama.ai will no longer allow uploads of SQL Server 2014 starting May 24th, 2024 and will be fully deprecated on July 5th, 2024. Additionally, any existing SQL Server 2014 databases will be migrated to SQL Server 2019 on the deprecation date of July 5th, 2024. This means if you download these databases you will receive them as SQL Server 2019. If this is problematic, you can use our APIs to extract your data. Please contact Coupa Support for questions or assistance.
When uploading databases to llama.ai from the platform, if the SQL Server version is 2014 or earlier, you will be notified that the database will be upgraded to SQL Server 2019. You can either click Upgrade to continue the upload or cancel. When you do upload, the local SQL database is not affected.
If you are uploading a model from Supply Chain Guru X or Data Guru, if the SQL Server version is 2014 or earlier, the database will be uploaded and upgraded to SQL Server 2019 without a notification and confirmation step.
Demand Modeler
Exporting to CSV files
Demand Modeler can sometimes generate large amounts of data. Modelers may want to download this data for internal analysis. When exporting to Microsoft Excel, however, this is limited to less than a million records. For more than a million records, a modeler will now be able to download data using a CSV file.
When data is exported from a specific table from Demand Modeler, the export file type (Excel or CSV) is dependent on the number of records in the table:
-
For up to 100,000 records, the data is exported to an Excel file
-
For more than 100,000 records, the data is exported to an CSV file.This file type supports exporting up to 5 million records
The export uses any filters applied to the data in view.
The Launch Pad now displays the export process as Data Export.
Prescriptions
Enhancements to Cost Prescriptions
The Cost prescriptions interface has been enhanced to make the results of Cost prescriptions easier to understand at a glance. Changes include:
-
The Run Options for Cost Prescriptions now support site groups and product groups. You can use these groups to exclude sites from Node Skipping, set Mode Switch Constraints for sites and products, and set Shipment Frequency Options for sites and products.
-
The maps on the Prescriptions’ Detail page now include direction of flow indicators and tooltips to show the flow details.
Updated Node Skipping Detail page
Previously, the “Before Node Skipping was Applied” map and the “Affected Lanes” table included all lane changes for all products. This made it difficult to determine which lane changes affected which products. These visualizations will now display only the lane changes prescribed for the product selected in the Product Insights table.
Enhancements to Risk Prescriptions
The Risk Prescriptions interface has been enhanced to make the results of prescriptions easier to understand at a glance. Changes include:
-
On the Network Risk Prescriptions page, new columns have been added to the grid to give the user a better idea of the effects of the prescription. The new columns are:
-
Is Current Top Site-Product?
-
Is Potential Top Site-Product?
-
# of Downstream changes
-
# of Upstream changes
-
-
On the Network Risk Prescriptions page, the “Current Flow Quantity” and “Potential Flow Quantity” columns have been removed. These columns appear on the Prescriptions Detail page.
-
On the Prescriptions Detail page, the “Current Network” and “Proposed Network” tables have been merged to create a single summary table for the prescription. This table includes a new “Change Type” column to indicate whether the prescription affects the flow upstream or downstream.
-
On the Prescriptions Detail page, the maps now include direction of flow indicators and tooltips to show the flow details.
App Studio
App Studio Tracking
New App Studio Tracking App
The new Tracking app gives Customer Administrators a way to monitor and support the highly customized App Studio solutions that our customers are creating and running within the Supply Chain platform. This app helps diagnose a number of performance, scaling and concurrency issues that are very difficult to diagnose.
The new Tracking app captures and displays metrics for:
-
Apps
-
App Boards
-
Databases and other assets
-
Macros
The Tracking app is now available to Customer Administrators on the Supply Chain home page's Administration menu.
Modeler
Platform support for model versions
The Supply Chain platform supports solving models with a database schema of up to 1 year old. As of May 2024 release (R39), this includes models from releases back to the R37 release (schema version 405000). Models with unsupported schemas must be upgraded prior to solving, modeling, using with apps or solving on the cloud. As of R39, support is ending for the following schema version, as well as older model schemas:
-
Release R36 (schema 404000)
Direct access to Data Visualizations
You can create visualization workbooks based on data in your Supply Chain models. You can access Data Visualizations directly from your model when it is open in Modeler using the Visualizations icon![]() in the Analysis section of the Navigation pane. If there is already a workbook defined for the model, the workbook is opened in a new browser tab. If there is no workbook defined, you see a flyout where you enter the name for the workbook. When you click Save, the workbook is created and opened in Data Visualizations.
in the Analysis section of the Navigation pane. If there is already a workbook defined for the model, the workbook is opened in a new browser tab. If there is no workbook defined, you see a flyout where you enter the name for the workbook. When you click Save, the workbook is created and opened in Data Visualizations.
New Allocation Constraint tables
A set of Network Optimization allocation constraints tables were added to the model schema in the previous release. In this release, the tables are available in the user interface and will be used by Network Optimization:
-
Flow Allocation Constraints
-
Inventory Allocation Constraints
-
Production Allocation Constraints
Use these tables to constrain the allocation of flow, inventory, or production. For example, you can define a flow allocation constraint that requires:
The flow quantity through the sites specified by MexicoSites must be at least 40% of the flow quantity through all sites.
In this case you define a set containing the sites in Mexico and evaluate it against a filter column where the value contains all sites. The constraint is defined with a Percentage (the set compared to the filter), a constraint Type (Min, Max, Fixed, Cond_Min, Cond_Fixed) and a Basis (Quantity, Weight, or Volume).
Workaround: You can manually enter site-related values. The user interface will flag them as invalid, but they will be written as expected when running the model. Keep in mind that you cannot change the Destination value from "Each" to "All" at this time, due to the user interface issue.
Max Capital Investment option update
The Max Capital Investment option is no longer displayed on the Technology Constraints tab in NO Run Options. You now control this value using the MAX_CAPEX value in the Config_NO table. Enter a positive value and set the Status to “Include” to use the maximum capital investment constraint.
Important notes:
-
Please review columns that have a Description of Change values of "Data Type change" or "Change in Required". If you use these columns in a workflow, you may need to adjust the workflow to support the new data type.
Input Tables
|
Table |
Column |
Description of Change |
Model Database Table Name |
Model Database Column Name |
Data Type |
Required |
|---|---|---|---|---|---|---|
|
Input Tables |
||||||
|
Taxable Value Overrides |
Product Value Override |
Data Type change (Float to Text) |
TaxableValueOverrides |
UserDefinedProductValue |
Text |
No |
|
Periods |
Start Date |
Change in Required |
Periods |
PeriodStart |
DateTime |
Yes |
Output Tables
|
Table |
Column |
Description of Change |
Model Database Table Name |
Model Database Column Name |
Data Type |
|---|---|---|---|---|---|
|
Output Tables |
|||||
|
Network Summary |
Total Sequential Objective Cost |
Column removed from User Interface |
OptimizationOutputNetworkSumary |
TotalSequentialObjectiveCost |
Money |
|
Unscheduled Routes |
Reason |
New column |
UnscheduledRoutes |
Reason |
Text |
|
Not displayed in UI (backend table for Cost To Serve Analysis) |
Not displayed in UI |
New column |
OptimizationOutputCostAllocation_Site |
SiteVariableCost |
Money |
Data Visualizations
Opening models from Data Visualizations home page
You can now open a workbook's associated model in Modeler directly from the Options menu  for a workbook on the Data Visualizations home page.
New Data Visualizations tool
Modelers need to create charts, grids, and maps to summarize model inputs, validate baselines, and compare model output across scenarios. The new Data Visualizations tool allows modelers to create dashboards to support key supply chain functions and KPIs that will allow quicker iteration times on model analysis and validation.
This release supports visualization work flows for Network Optimization and Inventory Optimization.
Supply Chain Home Page
User Settings
Updates to User Settings
When you click the user icon on any of the Supply Chain pages, you can select the User Settings option. User Settings provides access to:
-
Changing your password
-
Generating an API key
-
Email notifications
Email Notifications
Many actions in the Supply Chain platform trigger email notifications to be sent. The Email Notifications feature in User Settings allows you to opt in/opt out of some of these notifications. Uncheck any notifications you do not want to receive and click Save to prevent further notifications. You can opt back in at any time. Note: Email notifications that contain links, such as file downloads from the platform and password resets are not available for opt out.
Account activation period extended
The expiration period for the llama.ai account activation URL that is sent via email has been increased to 30 days.
Data Management
Renaming uploaded databases
When uploading a file with the .mdf extension, you can optionally change the name of the uploaded asset. The default asset type will be “Database”, but you can change the type to “Model” if the file is a supply chain model.
Prescriptions
Updated units of measure displayed in dashboards
Supply Chain Prescriptions now displays the appropriate labels for the units of measure that exist in your model (currency, distance, volume, etc). Previously, all labels were set to U.S. dollars, pounds, and miles.
Volume Consolidation improvements
The following improvements have been made to Volume Consolidation prescriptions:
-
The Volume Consolidation algorithm has been improved and cost savings should increase.
-
The Volume Consolidation algorithm now uses the cost calculator and the basis specified by the user within Volume Consolidation rather than using a “per mile per pound” basis. You can now choose to estimate cost based on units rather than weight. This is useful if the model doesn't have weight information.
App Studio
New App Studio Tracking App
The new Tracking app gives Customer Administrators a way to monitor and support the highly customized App Studio solutions that our customers are creating and running within the Supply Chain platform. This app helps diagnose a number of performance, scaling and concurrency issues that are very difficult to diagnose.
The new Tracking app captures and displays metrics for:
-
Apps
-
App Boards
-
Databases and other assets
-
Macros
The Tracking app is available to Customer Administrators by contacting Customer Support.
Macros
New Select Action
The new Select action allows you to choose columns from a single table or multiple joined tables to produce an output record set that can be written to a new or existing table. You can:
-
Use Table mapping to define relationships that indicate which records are included (Join types).
-
Use a computed field to create an expression that computes a value using fields from one or more tables.
-
When using an existing table as the output, use field mapping to map output fields to the existing table structure.
This action enables a simplified workflow compared to using the existing Create Table and Insert actions:
-
You do not need to specifically know or define the structure of the table first.
-
The table does not need to exist before the “insert” part can be constructed.
-
The table is dropped when refilled, so it doesn’t matter if there is an older definition of it currently in existence.
This new action does not replace the Create Table or Insert actions.
This function is the Macros analogue of the Select Transform in Data Guru. The Select Transform action in Data Guru performs the functions of both Select and Insert actions in the same transform: using an existing table or creating a new table is selected via a radio button.
New Update Table Action
The new Update Table action updates existing rows in a single table. It also allows you to add new columns to the table before updating, but not to add new rows.
This is different from the existing Update Action, which allows updating of existing columns in multiple tables, as well as assigning values to parameter values.
The new action simplifies the workflow compared to using the existing Add Column action and Update action:
-
There is only one table involved.
-
Columns do not need to exist in the table in order for the update to be built. You can add new columns to the table and then update them in a single action.
-
There are no ordering considerations.
This is the Macros analogue of the Update Transform in Data Guru.
Modeler
Platform support for model versions
The Supply Chain platform supports solving models with a database schema of up to 1 year old. As of January 2024 release (R38), this includes models from releases back to the R36 release (schema version 404000). Models with unsupported schemas must be upgraded prior to solving, modeling, using with apps or solving on the cloud. As of R38, support is ending for the following schema versions, as well as older model schemas:
-
Release R34 (schema 402000)
-
Release R35 (schema 403000)
Driver Scheduling duty duration
The driver Duty Duration has been added to the Driver Summary output table for Transportation Optimization.
Improved cost allocation in shipment output tables
Shipment output tables now define both Distance-Based Allocated Cost and Time-Based Allocated Cost. The new Time-Based Allocated Cost enables you to account for excessively long load and unload times. This uses the product of the shipment’s quantity and the travel time on the route combined with load and unload times. These values are in the Shipment Output and Delivered Shipments output tables for Transportation Optimization.
Start and end of route service time input for Transportation Assets
You can define specific service times that apply to the start and end of each route. These service times can account for pre- and post-route activities such as documentation and vehicle refueling. Use the Start Of Route Service Time and End Of Route Service Time columns in Transportation Assets to define the time for these activities.
Duplicate constraint names excluded from Network Optimization input files
If you defined multiple constraints in a table with the same name, duplicate constraint names were being written to input files. In this case, Network Optimization uses the last constraint record written to the input file and ignores all duplicates. This behavior has been changed so that in the case of duplicate constraint names, only the first record is written to the input file. The duplicates are reported in the ErrorLog.txt file
Spatial constraint costs in Cost To Serve
Expansion costs, the Fixed Operating Space Expansion Cost from Sites and the Floor Expansion Cost from Site Storage Spaces and Site Shipping Spaces, are currently included in Other Cost in Cost To Serve Details. The Site Variable Cost from Sites is currently included in the Total Cost value.
Important notes:
-
Several new tables are not yet in use and have not been exposed in the user interface: Production Allocation Constraints, Distribution Allocation Constraints, Inventory Allocation Constraints, and Rapid Network Explorer Summary.
-
Please review columns that have a Description of Change values of "Data Type change" or "Change in Required". If you use these columns in a workflow, you may need to adjust the workflow to support the new data type.
Input Tables
|
Table |
Column |
Description of Change |
Model Database Table Name |
Model Database Column Name |
Data Type |
Required |
|---|---|---|---|---|---|---|
|
Input Tables |
||||||
|
Transportation Policies Multi-Period
|
Duty Rate |
Data Type change (Float to Text) |
TransportationPoliciesMultiPeriod |
DutyRate |
Text |
No |
|
Return Trip Cost |
Data Type change (Float to Text) |
TransportationPoliciesMultiPeriod |
ReturnTripCost |
Text |
No |
|
|
Unit Load Cost |
Data Type change (Float to Text) |
TransportationPoliciesMultiPeriod |
LoadCost |
Text |
No |
|
|
Unit Unload Cost |
Data Type change (Float to Text) |
TransportationPoliciesMultiPeriod |
UnloadCost |
Text |
No |
|
|
Transportation Assets
|
Start Of Route Service Time |
New column |
TransportationAssets |
StartOfRouteServiceTime |
Text |
No |
|
End Of Route Service Time |
New column |
TransportationAssets |
EndOfRouteServiceTime |
Text |
No |
|
|
Production Allocation Constraints
|
Expression |
New table/column |
ProductionAllocationConstraints |
Expression |
Text |
No |
|
Period |
New table/column |
ProductionAllocationConstraints |
PeriodName |
Text |
No |
|
|
Site |
New table/column |
ProductionAllocationConstraints |
SiteName |
Text |
No |
|
|
Product |
New table/column |
ProductionAllocationConstraints |
ProductName |
Text |
No |
|
|
Process |
New table/column |
ProductionAllocationConstraints |
ProcessName |
Text |
No |
|
|
BOM |
New table/column |
ProductionAllocationConstraints |
BOMName |
Text |
No |
|
|
Period Filter |
New table/column |
ProductionAllocationConstraints |
PeriodFilter |
Text |
No |
|
|
Site Filter |
New table/column |
ProductionAllocationConstraints |
SiteFilter |
Text |
No |
|
|
Product Filter |
New table/column |
ProductionAllocationConstraints |
ProductFilter |
Text |
No |
|
|
Process Filter |
New table/column |
ProductionAllocationConstraints |
ProcessFilter |
Text |
No |
|
|
BOM Filter |
New table/column |
ProductionAllocationConstraints |
BOMFilter |
Text |
No |
|
|
Percent |
New table/column |
ProductionAllocationConstraints |
Percent |
Float |
No |
|
|
Type |
New table/column |
ProductionAllocationConstraints |
Type |
Text |
No |
|
|
Basis |
New table/column |
ProductionAllocationConstraints |
Basis |
Text |
No |
|
|
Status |
New table/column |
ProductionAllocationConstraints |
Status |
Text |
No |
|
|
Notes |
New table/column |
ProductionAllocationConstraints |
Notes |
Text |
No |
|
|
Period Collection Basis |
New table/column (Not exposed) |
ProductionAllocationConstraints |
CollectionBasisPeriodName |
Text |
No |
|
|
Site Collection Basis |
New table/column (Not exposed) |
ProductionAllocationConstraints |
CollectionBasisSiteName |
Text |
No |
|
|
Product Collection Basis |
New table/column (Not exposed) |
ProductionAllocationConstraints |
CollectionBasisProductName |
Text |
No |
|
|
Process Collection Basis |
New table/column (Not exposed) |
ProductionAllocationConstraints |
CollectionBasisProcessName |
Text |
No |
|
|
BOM Collection Basis |
New table/column (Not exposed) |
ProductionAllocationConstraints |
CollectionBasisBOMName |
Text |
No |
|
|
Distribution Allocation Constraints
|
Expression |
New table/column |
DistributionAllocationConstraints |
Expression |
Text |
No |
|
Period |
New table/column |
DistributionAllocationConstraints |
PeriodName |
Text |
No |
|
|
Source |
New table/column |
DistributionAllocationConstraints |
SourceName |
Text |
No |
|
|
Destination |
New table/column |
DistributionAllocationConstraints |
DestinationName |
Text |
No |
|
|
Product |
New table/column |
DistributionAllocationConstraints |
ProductName |
Text |
No |
|
|
Mode |
New table/column |
DistributionAllocationConstraints |
ModeName |
Text |
No |
|
|
Period Filter |
New table/column |
DistributionAllocationConstraints |
PeriodFilter |
Text |
No |
|
|
Source Filter |
New table/column |
DistributionAllocationConstraints |
SourceFilter |
Text |
No |
|
|
Destination Filter |
New table/column |
DistributionAllocationConstraints |
DestinationFilter |
Text |
No |
|
|
Product Filter |
New table/column |
DistributionAllocationConstraints |
ProductFilter |
Text |
No |
|
|
Mode Filter |
New table/column |
DistributionAllocationConstraints |
ModeFilter |
Text |
No |
|
|
Percent |
New table/column |
DistributionAllocationConstraints |
Percent |
Float |
No |
|
|
Type |
New table/column |
DistributionAllocationConstraints |
Type |
Text |
No |
|
|
Basis |
New table/column |
DistributionAllocationConstraints |
Basis |
Text |
No |
|
|
Status |
New table/column |
DistributionAllocationConstraints |
Status |
Text |
No |
|
|
Notes |
New table/column |
DistributionAllocationConstraints |
Notes |
Text |
No |
|
|
Period Collection Basis |
New table/column (Not exposed) |
DistributionAllocationConstraints |
CollectionBasisPeriodName |
Text |
No |
|
|
Source Collection Basis |
New table/column (Not exposed) |
DistributionAllocationConstraints |
CollectionBasisSourceName |
Text |
No |
|
|
Destination Collection Basis |
New table/column (Not exposed) |
DistributionAllocationConstraints |
CollectionBasisDestinationName |
Text |
No |
|
|
Product Collection Basis |
New table/column (Not exposed) |
DistributionAllocationConstraints |
CollectionBasisProductName |
Text |
No |
|
|
Mode Collection Basis |
New table/column (Not exposed) |
DistributionAllocationConstraints |
CollectionBasisModeName |
Text |
No |
|
|
Inventory Allocation Constraints |
Expression |
New table/column |
InventoryAllocationConstraints |
Expression |
Text |
No |
|
Period |
New table/column |
InventoryAllocationConstraints |
PeriodName |
Text |
No |
|
|
Site |
New table/column |
InventoryAllocationConstraints |
SiteName |
Text |
No |
|
|
Product |
New table/column |
InventoryAllocationConstraints |
ProductName |
Text |
No |
|
|
Period Filter |
New table/column |
InventoryAllocationConstraints |
PeriodFilter |
Text |
No |
|
|
Site Filter |
New table/column |
InventoryAllocationConstraints |
SiteFilter |
Text |
No |
|
|
Product Filter |
New table/column |
InventoryAllocationConstraints |
ProductFilter |
Text |
No |
|
|
Percent |
New table/column |
InventoryAllocationConstraints |
Percent |
Float |
No |
|
|
Type |
New table/column |
InventoryAllocationConstraints |
Type |
Text |
No |
|
|
Basis |
New table/column |
InventoryAllocationConstraints |
Basis |
Text |
No |
|
|
Status |
New table/column |
InventoryAllocationConstraints |
Status |
Text |
No |
|
|
Notes |
New table/column |
InventoryAllocationConstraints |
Notes |
Text |
No |
|
|
Period Collection Basis |
New table/column (Not exposed) |
InventoryAllocationConstraints |
CollectionBasisPeriodName |
Text |
No |
|
|
Site Collection Basis |
New table/column (Not exposed) |
InventoryAllocationConstraints |
CollectionBasisSiteName |
Text |
No |
|
|
Product Collection Basis |
New table/column (Not exposed) |
InventoryAllocationConstraints |
CollectionBasisProductName |
Text |
No |
|
Output Tables
|
Table |
Column |
Description of Change |
Model Database Table Name |
Model Database Column Name |
Data Type |
|---|---|---|---|---|---|
|
Output Tables |
|||||
|
Driver Summary |
Duty Duration |
New column |
DriverSummary |
DutyDuration |
Float |
|
Shipment Output
|
Distance-Based Allocated Cost |
Column rename |
VRPOutputShipmentOutput |
AllocatedCost |
Money |
|
Time-Based Allocated Cost |
New column |
VRPOutputShipmentOutput |
TimeBasedAllocatedCost |
Money |
|
|
Delivered Shipments
|
Distance-Based Allocated Cost |
Column rename |
VRPOutputDeliveredShipments |
AllocatedCost |
Money |
|
Time-Based Allocated Cost |
New column |
VRPOutputDeliveredShipments |
TimeBasedAllocatedCost |
Money |
|
|
Rapid Network Explorer Summary |
RNE Scenario |
New table/column |
RapidNetworkExplorerSummary |
RNEScenario |
Text |
|
RNE Scenario ID |
New table/column |
RapidNetworkExplorerSummary |
RNEScenarioID |
Int |
|
|
Base Scenario |
New table/column |
RapidNetworkExplorerSummary |
BaseScenario |
Text |
|
|
Model Run Time |
New table/column |
RapidNetworkExplorerSummary |
ModelRunTime |
DateTime |
|
|
Solve Duration |
New table/column |
RapidNetworkExplorerSummary |
SolveDuration |
Float |
|
|
Gap % |
New table/column |
RapidNetworkExplorerSummary |
GapPercentage |
Float |
|
|
Total Profit Change |
New table/column |
RapidNetworkExplorerSummary |
TotalProfitChange |
Float |
|
|
Total Cost Change |
New table/column |
RapidNetworkExplorerSummary |
TotalCostChange |
Float |
|
|
Total Revenue Change |
New table/column |
RapidNetworkExplorerSummary |
TotalRevenueChange |
Float |
|
|
Total Transportation Cost Change |
New table/column |
RapidNetworkExplorerSummary |
TotalTransportationCostChange |
Float |
|
|
Total Production Cost Change |
New table/column |
RapidNetworkExplorerSummary |
TotalProductionCostChange |
Float |
|
|
Total Sourcing Cost Change |
New table/column |
RapidNetworkExplorerSummary |
TotalSourcingCostChange |
Float |
|
|
Total Warehousing Cost Change |
New table/column |
RapidNetworkExplorerSummary |
TotalWarehousingCostChange |
Float |
|
|
Total Inbound Warehousing Cost Change |
New table/column |
RapidNetworkExplorerSummary |
TotalInboundWarehousingCostChange |
Float |
|
|
Total Outbound Warehousing Cost Change |
New table/column |
RapidNetworkExplorerSummary |
TotalOutboundWarehousingCostChange |
Float |
|
|
Total Inv Holding Cost Change |
New table/column |
RapidNetworkExplorerSummary |
TotalInvHoldingCostChange |
Float |
|
|
Total Return Cost Change |
New table/column |
RapidNetworkExplorerSummary |
TotalReturnCostChange |
Float |
|
|
Total Fixed Startup Cost Change |
New table/column |
RapidNetworkExplorerSummary |
TotalFixedStartupCostChange |
Float |
|
|
Total Fixed Operating Cost Change |
New table/column |
RapidNetworkExplorerSummary |
TotalFixedOperatingCostChange |
Float |
|
|
Total Closing Cost Change |
New table/column |
RapidNetworkExplorerSummary |
TotalClosingCostChange |
Float |
|
|
Total Capital Investment Change |
New table/column |
RapidNetworkExplorerSummary |
TotalCapitalInvestmentChange |
Float |
|
|
Space Expansion Cost Change |
New table/column |
RapidNetworkExplorerSummary |
SpaceExpansionCostChange |
Float |
|
|
Site Variable Cost Change |
New table/column |
RapidNetworkExplorerSummary |
SiteVariableCostChange |
Float |
|
|
Total Transportation Asset Cost Change |
New table/column |
RapidNetworkExplorerSummary |
TotalTransportationAssetCostChange |
Float |
|
|
Total Work Resource Cost Change |
New table/column |
RapidNetworkExplorerSummary |
TotalWorkResourceCostChange |
Float |
|
|
Total Tax Cost Change |
New table/column |
RapidNetworkExplorerSummary |
TotalTaxCostChange |
Float |
|
|
Total Duty Cost Change |
New table/column |
RapidNetworkExplorerSummary |
TotalDutyCostChange |
Float |
|
|
Total Carbon Cost Change |
New table/column |
RapidNetworkExplorerSummary |
TotalCarbonCostChange |
Float |
|
|
Optimized Carbon Offset Cost Change |
New table/column |
RapidNetworkExplorerSummary |
OptimizedCarbonOffsetCostChange |
Float |
|
|
Total Expression Based Cost Change |
New table/column |
RapidNetworkExplorerSummary |
TotalExpressionBasedCostChange |
Float |
|
|
Total Late Demand Penalty Cost Change |
New table/column |
RapidNetworkExplorerSummary |
TotalLateDemandPenaltyCostChange |
Float |
|
|
Total Early Demand Penalty Cost Change |
New table/column |
RapidNetworkExplorerSummary |
TotalEarlyDemandPenaltyCostChange |
Float |
|
|
Total Unserved Demand Penalty Cost Change |
New table/column |
RapidNetworkExplorerSummary |
TotalUnservedDemandPenaltyCostChange |
Float |
|
|
Total Demand Penalty Cost Change |
New table/column |
RapidNetworkExplorerSummary |
TotalDemandPenaltyCostChange |
Float |
|
|
Total Unserved Demand Qty Change |
New table/column |
RapidNetworkExplorerSummary |
TotalUnservedDemandQtyChange |
Float |
|
|
% Demand On-Time Change |
New table/column |
RapidNetworkExplorerSummary |
PercentDemandOnTimeChange |
Float |
|
|
% Demand Late Change |
New table/column |
RapidNetworkExplorerSummary |
PercentDemandLateChange |
Float |
|
|
% Demand Early Change |
New table/column |
RapidNetworkExplorerSummary |
PercentDemandEarlyChange |
Float |
|
|
Total Cycle Stock Change |
New table/column |
RapidNetworkExplorerSummary |
TotalCycleStockChange |
Float |
|
|
Total Min Inventory Change |
New table/column |
RapidNetworkExplorerSummary |
TotalMinInventoryChange |
Float |
|
|
Total Pre Build Inventory Change |
New table/column |
RapidNetworkExplorerSummary |
TotalPreBuildInventoryChange |
Float |
|
|
Total CO2 Change |
New table/column |
RapidNetworkExplorerSummary |
TotalCO2Change |
Float |
|
|
Optimized Carbon Offsets Change |
New table/column |
RapidNetworkExplorerSummary |
OptimizedCarbonOffsetsChange |
Float |
|
|
Network Risk Health Change |
New table/column |
RapidNetworkExplorerSummary |
NetworkRiskHealthChange |
Float |
|
|
Scenario ID |
New table/column |
RapidNetworkExplorerSummary |
ScenarioID |
Int |
|
|
Sub-Scenario ID |
New table/column |
RapidNetworkExplorerSummary |
StepNumber |
Int |
|
Supply Chain Home Page
Data Management
Control over column width
You can now adjust the widths of columns in the Data Management grid. This is helpful when distinguishing assets that have similar lengthy names. When you leave and return to the Data Management page, the default column widths are applied.
Asset size values in Data Management
Data Management now provides information about the physical size of assets. In the grid, there is a Size column. The Size column value can be refreshed at any time by selecting Refresh Asset Size from the kebab menu for a given asset. When viewing the Details of a selected asset, you see the last calculated size and the date when this value was refreshed. Keep in mind that when downloading an asset, the actual size of the downloaded file is likely to be smaller than the value reported in Data Management.
SQL Server version information for assets in Data Management
When you view the Details for a selected asset, the SQL Server version is displayed in the top section of the flyout.
CSV export from database and DDM tables
You can export up to 10,000 records from tables in user defined databases and DDMs to a .csv format file. When you view a database or DDM in Data Management and select a table, the Export option is available in the header for the table.
Prescriptions
Network Risk prescriptions added
In addition to the complexity of supply chains, they inherently involve risk. Recent years have highlighted that risk, as companies have struggled to overcome a variety of challenges to their supply chains. Single- and multi-point failures can lead to major disruptions of the supply chain, impacting corporate revenue and reputation. Modelers need to quantify and model risk in their supply chains as they work to make their supply chains more resilient and cost effective.
With the new Supply Chain Prescriptions Risk feature, you can mitigate the effects of potential single point failures that can lead to disruption of the supply chain network. The Risk app identifies sites and lanes that are critical from a revenue or value of goods flown perspective, and then generates constraints that must be imposed on the network to minimize the risk of those critical sites and lanes. The constraints correspond to various levels of risk. There are four types of prescriptions for Risk:
-
Alternate supplier sites
-
Alternate manufacturer sites
-
Alternate distribution centers
-
Flow shifts
These prescriptions can be reviewed by supply chain managers, who can accept or reject the prescriptions.
App Studio
Document Grid Menu
A new right-click menu has been added to the column header on grid widgets in the Layout Designer and Application Viewer. Sorting, Fixing, Conditional Formatting, Clearing and Calculated Columns modification can now be applied to grids.
Macros
Import and Export Macros
The ability to Import and Export a macro has been added. Now, you can easily export a macro or a packaged folder of macros to share with others and import macros into your project to view and modify them.
Drop Table Logic Action
The ability to Drop a table from a macro has been added. Now, you can easily remove a table at the end of a macro run.
Modeler
Platform support for model versions
The Supply Chain platform supports solving models with a database schema of up to 1 year old. As of September 2023 release (R37), this includes models from releases back to the R34 release (schema version 402000). Models with unsupported schemas must be upgraded prior to solving, modeling, using with apps or solving on the cloud. As of R37, support is ending for the following schema version, as well as older model schemas:
-
Release R33 (schema 401000)
Technology display mode
The Technologies tab in Model Settings provides you with a way to limit the input and output information displayed based on the solver technology (or technologies) you use. For example, if you are currently working on a model for use with Network Optimization only, you do not need to see the tables and columns that are used only by Transportation Optimization, such as Rates and the Service Time columns on Sites. Turn on only the Network Optimization switch to hide information that applies to Inventory Optimization, Transportation Optimization and Simulation.
In addition, you can use the Basic mode to further limit the displayed tables and columns to only those required and most typically used when modeling.
See Technologies model options.
Early/late demand updates
The Customer Order Fulfillment table is no longer read-only. The Fulfillment ID,Single Source Fulfillment and Single Period Fulfillment columns in Customer Demand and Customer Orders are also no longer read-only. The Fulfillment ID column in both the Customer Demand and Customer Orders tables uses values defined in the Fulfillment ID column in the Customer Order Fulfillment table.
Updates to Sequential Objectives
A number of new Objective values are available in the Sequential Objectives input table:
| Penalty Cost | Customer Revenue | Fractional Return Destination Constraints |
| Total Closing Cost | Site Demand | Return Flow Balance Constraints |
| Total Duty Cost | Inventory Process | Return Process |
| Total Expression Based Cost | Maximum Number of Transportation Asset | Single Return Destination Constraints |
| Total Fixed Startup Cost | Batch Flow | Sourcing Process |
| Total Inbound Warehousing Cost | Production Process | Process BOM Connection |
| Total Outbound Warehousing Cost | Fractional Process Constraints | Process To Process Relation |
| Total InTransit InvCost | Single Process | Transportation Process |
| Total TPAsset Cost | Process Step Balance Constraints | |
| Total Work Resource Cost | Single Process Step |
Several Objective values have been removed, as they are not used by the Network Optimization solver:
-
Make Processes Single Sourcing
-
Make Processes Fractional Sourcing
-
Make Process Flow Single Destination
-
Make Process Flow Fractional Destination
If your Sequential Objectives table includes any of the objective values that have been removed, you will see a warning in the ErrorLog.txt when you run the model. However, this is expected since the solver does not use them.
Control over Cost To Serve internal table population
When you run Network Optimization, a number of internal tables are populated with data that is used by Cost To Serve Analysis. These tables can have significantly large numbers of records. You can use the new SKIP_COST_ALLOCATION_OUTPUT parameter in the Config_NO table to prevent these tables from being populated if you do not plan to use Cost To Serve Analysis. Make sure the Parameter Value is 1 and the Status is "Include" to enable this behavior.
Shipment-based rates
Transportation Optimization supports Per Unit Cost and Discount Rate values at the route level, where each shipment on the route is assigned the same cost and rate. You can use shipment-based rates where different costs and rates are allowed for each shipment on a route. This functionality enables you to define route costing and rating with increased granularity. It also provides a way to model LTL aggregation, where shipments with different LTL rates can be combined on a single route. First you assign a classification (Class Name) to the shipments, then create Per Unit Cost and Discount Rate values for each unique asset-source-destination-class combination in the Shipment-Based Rate table.
See Shipment-based rate.
Drone modeling updates
You can now constrain the maximum time that a drone waits at a location. Also, the Sortie ID has been added to the Shipment Output and Delivered Shipments output tables.
Driver scheduling updates
Additional columns have been added to let you constrain the Driver Scheduling problem type to adhere to regional driver requirements, such as US DOT regulations. You define the drive time for routes that are the source for Driver Scheduling. You can then constrain the maximum drive time that can be incurred per shift for a driver class.
Important notes:
-
If you have been using the Network Summary Total Demand Penalty column in any workflows, be advised that you should change the workflow to target the Total Unserved Demand Penalty Cost column instead. Total Demand Penalty has been removed from the model schema.
-
Please review columns that have a Description of Change values of "Data Type change" or "Change in Required". If you use these columns in a workflow, you may need to adjust the workflow to support the new data type.
Input Tables
|
Table |
Column |
Description of Change |
Model Database Table Name |
Model Database Column Name |
Data Type |
Required |
|---|---|---|---|---|---|---|
|
Input Tables |
||||||
|
Site Demand |
Unit Price |
Data Type change (Float to Text) |
SiteDemand |
UnitPrice |
Text |
No |
|
Shipments |
Class Name |
New column |
Shipments |
ClassName |
Text |
No |
|
Shipment-Based Rate
|
Asset Name |
New table/column |
ShipmentBasedRates |
TransportationAssetName |
Text |
No |
|
Source |
New table/column |
ShipmentBasedRates |
OriginLocationGroupID |
Text |
No |
|
|
Destination |
New table/column |
ShipmentBasedRates |
DestinationLocationGroupID |
Text |
No |
|
|
Class Name |
New table/column |
ShipmentBasedRates |
ClassName |
Text |
No |
|
|
Per Unit Cost |
New table/column |
ShipmentBasedRates |
PerUnitCost |
Text |
No |
|
|
Unit Cost Basis |
New table/column |
ShipmentBasedRates |
PerUnitCostBasis |
Text |
No |
|
|
Discount Rate |
New table/column |
ShipmentBasedRates |
DiscountRate |
Float |
No |
|
|
Status |
New table/column |
ShipmentBasedRates |
Status |
Text |
No |
|
|
Drones |
Max Waiting Time At Location |
New column |
DroneType |
MaxWaitingTime |
Text |
No |
|
Drivers |
Max Drive Time Per Shift |
New column |
Driver |
MaxDriveTimePerShift |
Text |
No |
|
Fixed Cost |
Change in Required (Modeler) |
Driver |
FixedCost |
Text |
Yes |
|
|
Allowed Assets |
Change in Required (Modeler) |
Driver |
AllowedEquipment |
Text |
Yes |
|
|
Routes |
Drive Time |
New column |
Routes |
DriveTime |
Text |
No |
|
Asset Origin |
Change in Required (Modeler) |
Routes |
AssetOrigin |
Text |
Yes |
|
|
Start Date Time |
Change in Required (Modeler) |
Routes |
StartDateTime |
DateTime |
Yes |
|
|
End Date Time |
Change in Required (Modeler) |
Routes |
EndDateTime |
DateTime |
Yes |
|
|
Customer Demand |
Fulfillment ID |
Changed to editable |
CustomerDemand |
FulfillmentID |
Text |
No |
|
Single Source Fulfillment |
Changed to editable |
CustomerDemand |
SingleSourceFulfillment |
Boolean |
Yes |
|
|
Single Period Fulfillment |
Changed to editable |
CustomerDemand |
SinglePeriodFulfillment |
Boolean |
Yes |
|
|
Customer Orders |
Fulfillment ID |
Changed to editable |
CustomerOrders |
FulfillmentID |
Text |
No |
|
Single Source Fulfillment |
Changed to editable |
CustomerOrders |
SingleSourceFulfillment |
Boolean |
Yes |
|
|
Single Period Fulfillment |
Changed to editable |
CustomerOrders |
SinglePeriodFulfillment |
Boolean |
Yes |
|
|
Customer Order Fulfillment
|
Fulfillment ID |
Changed to editable |
CustomerOrderFulfillment |
FulfillmentID |
Text |
Yes |
|
Single Source Fulfillment |
Changed to editable |
CustomerOrderFulfillment |
SingleSourceFulfillment |
Boolean |
Yes |
|
|
Single Period Fulfillment |
Changed to editable |
CustomerOrderFulfillment |
SinglePeriodFulfillment |
Boolean |
Yes |
|
|
Status |
Changed to editable |
CustomerOrderFulfillment |
Status |
Text |
No |
|
Output Tables
|
Table |
Column |
Description of Change |
Model Database Table Name |
Model Database Column Name |
Data Type |
|---|---|---|---|---|---|
|
Output Tables |
|||||
|
Network Summary |
Total Demand Penalty |
Column removed |
OptimizationOutputNetworkSummary |
TotalDemandPenalty |
Money |
|
Driver Summary |
Drive Duration |
New column |
DriverSummary |
DriveDuration |
Float |
|
Number Of Shifts |
New column |
DriverSummary |
NumberOfShifts |
Int |
|
|
Driver Schedule |
Drive Time |
New column |
DriverSchedule |
DriveTime |
Float |
|
Unscheduled Routes |
Drive Time |
New column |
UnscheduledRoutes |
DriveTime |
Float |
|
Sortie Summary |
Sortie ID |
New column |
SortieOutput |
SortieID |
Int |
|
Input Shipments |
Class Name |
New column |
VRPOutputShipments |
ClassName |
Text |
|
Shipment Output |
Class Name |
New column |
VRPOutputShipmentOutput |
ClassName |
Text |
|
Sortie ID |
New column |
VRPOutputShipmentOutput |
SortieID |
Int |
|
|
Delivered Shipments |
Class Name |
New column |
VRPOutputDeliveredShipments |
ClassName |
Text |
|
Sortie ID |
New column |
VRPOutputDeliveredShipments |
SortieID |
Int |
|
|
Segments |
Sequence ID |
Data Type change (Text to Int) |
VRPOutputSegments |
SequenceID |
Int |
|
Stops |
Sequence ID |
Data Type change (Text to Int) |
VRPOutputStops |
SequenceID |
Int |
Optional solver parameter changes
This table lists parameters that have been added to the Advanced Parameter Tables for the various technologies:
|
Technology |
Parameter Name |
Description of Change |
Parameter Value |
Parameter Description |
|---|---|---|---|---|
|
Network Optimization |
SKIP_COST_ALLOCATION_OUTPUT |
New parameter |
1 |
Set this parameter to 1 to prevent the population of the OptimizationOutputCostAllocation_Lane, OptimizationOutputCostAllocation_Site, and OptimizationOutputCostAllocation_SiteProduct tables. These tables are used for the Cost To Serve Analysis problem type, so if you do not plan to use Cost To Serve, you can set this parameter to 1 and include this parameter to prevent population of the tables during Network Optimization. |
|
Network Optimization |
SCALE_MIN_VALUE |
New parameter |
1 |
When this parameter is set to 0, the minimum flow value for Flow Count Constraints is determined between the scaled minimum demand and 1. When this parameter is set to 1, the minimum flow value is determined between the scaled minimum demand and 1, then divided by the scaling factor specified by SCALE_QTY_INPUT. The minimum demand is scaled when "Calibrate Data Before Optimization" is on. |
Supply Chain API
Endpoints removed for Insights
All endpoints for the Insights product have been removed from the Supply Chain API.
New endpoints
- GET /v4/dataset/{datasetId}/collection/{collection}/record/pointer
Returns data from a dataset collection, given the dataset ID and the collection name. Pass paging size and the index key with the request to retrieve data from any key of the collection.
- GET /v4/model/{modelId}/table/{tableName}/record/pointer
Returns data from a table in a model by the model ID. Pass paging size and index key with the request to retrieve data from any key of the table.
For more information on using the Supply Chain API, see the Supply Chain API Portal at https://developer.llama.ai.
App Studio and Macros
Addition of CountZ and CountAllZ functions
The CountZ and CountAllZ functions have been added to the system. The CountZ and CountAllZ functions are the similar to the Count and CountAll functions, except that nulls are treated as zero.
Statement Editor update
For auto incremented columns and computed columns, the Statement Editor is unavailable. These types of columns are computed automatically by the system.
Macros
Using the Snap Grid
A new Snap Grid button has been added to the design surface to enable you to show or hide a grid on the design surface. Now, you can easily snap a grid to the design surface.
Using the Zoom Slider
A new Zoom Level Slider has been added to the design surface to enable you to easily zoom in and out of the design surface. Now, you can quickly zoom in and out to better navigate the design surface.
Copy and paste a macro action
The ability to copy a macro action has been added while working on the macro. This will save time if you need to insert similar actions into another macro with small changes for each action.
Excel Import action update
The ability to specify that all empty cells are treated as null or default empty values has been added to Excel Import Action.
Prescriptions
SCDP 36.3.0 Change to Node Skipping
Node Skipping prescriptions will now match “Source”, “Destination” and “Product” for a lane rather than just matching “Source” and “Destination”. If a lane matches the Source, Destination, and Product values of any flow constraint in Modeler, Prescriptions will “exclude” that flow constraint and include the prescription.
Change to the Web address for Supply Chain Prescriptions
The Web address for Supply Chain Prescriptions has been changed to us.llama.ai/prescriptions for U.S. customers and eu.llama.ai/prescriptions for E.U. customers.
Accepting and rejecting prescriptions (Prescriptions Lifecycle Management)
Users will now be able to accept or reject prescriptions according to the operational feasibility in their supply chains. This allows the Prescriptions engine to learn from the user what prescriptions are feasible or infeasible, and to generate more business-relevant prescriptions. The user can then spend less time reviewing prescriptions that are not relevant to their business.
The Supply Chain Prescriptions user will be able to:
-
Accept a prescription or a group of prescriptions
-
Reject prescriptions in bulk due to quantity, potential savings, volume, and weight
-
Access an archive that shows a list of criteria on which prescriptions were previously rejected
Updated Prescriptions Summary page
The Prescriptions Summary page has been enhanced to provide more information at a glance.
The Summary header now includes:
-
The total number of prescriptions
-
The total number of accepted prescriptions (once prescriptions have been accepted )
-
The total accepted savings (once prescriptions have been accepted )
-
A tooltip that describes the savings, including a summary of the number of prescriptions that have been accepted in the current run
The Summary page also now includes these enhancements:
-
The Potential Savings by Prescription Type and Insights on Potential Savings charts are next to each other for easier viewing
-
The Top Factors Increasing and Decreasing bar chart is now color coded by increasing and decreasing costs and the chart has been moved above the Top 10 Prescriptions grid
-
The fixed bar chart labels are now available as tool tips. Hover over a chart bar to see the precise value for that bar
-
The charts have been updated to include horizontal grid lines to make the charts easier to read
-
The Summary page now appears when a run is completed so that the user can quickly see results.
Updated Prescriptive Insights pages
The Prescriptive Insights pages have been restructured to provide more information at a glance. These pages will now display the Prescriptions grid automatically. You can view the details for a prescription by clicking the prescription’s ID link.
For the Mode Switching and Volume Consolidation pages, you can view the Overview tab for the prescription type by clicking the Overview tab at the top of the page.
New “All Prescriptions” page
The “Export to Model” page has been renamed to “All Prescriptions”, and the prescriptions grid has been updated to include more information about each prescription. In particular, the grid now includes two new columns:
-
The new Status column indicates if the prescription has been accepted, rejected, or not yet reviewed.
-
The new Exported column indicates if the prescription has been exported to Modeler.
Prescriptions export enhancements
The Prescriptions export processes have been changed to only export prescriptions with a status of “Accepted” or “Unreviewed”.
Searching for projects and models
On the Prescriptions home page, the Search field can be used to search for a specific model as well as a project.
Demand Modeler
SCDP 36.1.0 New parameters
The following advanced scenario parameters have been added:
-
Batch Size: Specifies the max number of historical feature matrix records to pass to each concurrent execution of the feature selection method.
-
Feature Report Filter Selected Features: Specifies whether or not to show only features selected for inclusion in an LOD’s local models in the Feature Report.
-
Enable New Product Introduction?: Specifies whether or not to generate forecasts for LODs that have insufficient history to be forecasted with local algorithms.
-
Ensembler Weights: A dictionary specifying how much weight to assign to each estimator in the ensembler (if the Forecast Strategy main parameter is set to “Ensemble”). If left blank, all estimators receive equal weight.
-
Imputation Strategy: Specifies the method to use to impute mapped features and trend cloud features. Supported options are: Backward Fill, Fill NA Value, Forward Fill, Lag, Moving Average.
-
Imputation Value: Specifies the value to pass along with the Imputation Strategy when the strategy is Fill NA Value, Lag, or Moving Average.
-
Fold Overlap Size: Specifies the number of historical periods to share between one backtesting fold and the next.
-
Overlap Unbiased Fold: Specifies whether the Fold Overlap Size (when greater than 0) applies to unbiased test folds in addition to estimator selection folds.
-
Seasonal Cycle Detection Method: The method to use to detect seasonal cycle frequencies when Best Seasonal Cycles is None. Supported options are: PyCaret, ACF, FFT. PyCaret is used when this parameter is blank.
A new Trend Cloud option has been added:
-
Enhanced Logging: Specifies whether or not detailed logging will be conducted during the Pull Trend Cloud action
SCDP 36.1.0 New filter behavior based on the Level of Detail parameter
The filters for the three main dimensions on the Output Overview pages now behave a little differently. The option ALL is available only when dimensions are not selected in the Level of Detail parameter on the scenario's Advanced Parameters tab.
Modeler
SCDP 36.1.0 Validation for user defined columns
Input table validation has been extended to user defined text columns that are defined with a specific Usage, such as "Customers" and "Status". This feature applies to user defined columns in standard tables and in user defined tables.
Platform support for model versions
The Supply Chain platform supports models with a database schema of up to 1 year old. As of release 36.0.0, this includes models from releases back to the R34 release (schema version 402000). Models with unsupported schemas must be upgraded prior to solving, modeling, using with apps or solving on the cloud. Support is ending for the following schema versions:
-
Release R30 (schema 303007)
-
Release R31 (schema 303009)
-
Release R32 (schema 400000)
-
Release R33 (schema 401000)
According to our standard support policy, we plan to retire Design Engines that are 1 year old or older. In an effort to provide advance notice, as part of the R37 release (planned for September 2023), we will be shutting down the R34 Design Engines.
Control over data formats in tables
Date, numeric, and currency values in tables can be difficult to read if not in a format that is typical for the user. The Data Formats tab in Model Options provides options that let you control the format for each of these types of values. For numeric and currency values, you set the number of decimal places, how negative values should be displayed and whether to include the thousands separator. Currencies also support options that let you select the position of the currency symbol, or hide the symbol. Dates offer short and long date and time formats, and an option to exclude the time component.
User defined tables and columns
You can create new user defined input tables that can, for example, serve as inputs to solver customizations or as data sources for input pipes. These tables are maintained when models are upgraded for new product releases.
User defined columns let you add columns to existing input tables or to user defined tables. You can use these columns for filtering tables and for storing additional information not covered by standard columns. You specify the data type for each column: text, integer, decimal or date. For the text columns, you can optionally specify a usage such as "Customers" or "Products". When a usage has been applied, the record names, groups names and filter names defined for the usage will be available in the dropdown list for the user defined column value. This behavior is similar to what is available in the Customer column in the Customer Demand input table. User defined columns can be deleted as needed.
Appending records with table import
When using the Import feature to import records into a Modeler input table, you now have the choice of whether to replace all existing records or append the imported records to those already in the table. When appending, if any of the records from the source result in records that would violate duplicate entries in the table, the import will fail.
Early and late demand modeling
Early and late demand modeling allows you to specify demand records that can be served outside the demanded period. You can associate penalty costs for early/late fulfillment as well as limits on demand timing. You can prioritize demand, allowing models to be broken down to reduce overall complexity.
New columns in the Customer Demand and Customer Orders table let you define the demand timing and associated penalties. In Customer Demand, use Periods Allowed Early and Periods Allowed Late and the corresponding delivery penalty cost columns. Similarly, in Customer Orders, use Time Allowed Early and Time Allowed Late and the corresponding delivery penalty cost columns.
Columns have been added in a number of Network Optimization output tables, providing details about early and late demand fulfillment, including penalty costs. This information is available in Network Summary, Financial Summary, Network Organization Summary, Network Customer Summary, Network Product Summary and Customer Demand Summary.
See Demand timing.
Model decomposition
The decomposition method allows you to break a large model into smaller pieces and solve them more efficiently. For large models, this method can help reduce both solving time and memory usage significantly. Model decomposition extracts solvable sub-models from the original model by analyzing the complex relationship across all supply chain elements: products, sites, lanes, demand, bills of material, work centers, processes and constraints. In this release, the main focus is on the constraints related to products, so each sub-model will have a different subset of the products. Each sub-model contains only its own data which makes the problem size much smaller. After solving all the sub-models, the solution of the original model is obtained by merging the output of all the sub-models.
See Decomposition.
Sequential objectives
Objectives have been updated in the Sequential Objectives table:
-
"Total CO2 Emission" has been renamed to "Total CO2 Cost" to reflect the fact that this objective is based on the cost associated with CO2.
-
"Total CO2" has been added. This objective is based on the weight of carbon emissions.
-
"Carbon Footprint" has been renamed to "Maximum Carbon Footprint" since this is based on Maximum Carbon Footprint in the Greenhouse Gases table.
Predicted solve time
When running Network Optimization models, it can be hard to know the complexity of the problem and how long it will take to solve. The solve process includes an improved method to both identify a solve time range and highlight complexities in the model that may contribute to longer solve times. This information can help you understand what drives model complexity and how this affects solve times. The predictive information is displayed in several places:
-
The Scenario Status Queue on the Modeler landing page
-
The Scenario Queue on the Modeler Launch Pad
-
The General tab for a Queue Management Models
-
The solve log that is available in Queue Management
Drone modeling
Transportation Optimization includes the capability to model drones with ground transportation assets, enabling users to deploy drones that make deliveries in coordination with trucks. The trucks serve both as a mobile depot, where drone launches and retrievals are performed, and a delivery asset. Transportation Optimization determines where and how to incorporate drones into the logistics operations to improve last-mile delivery and reduce cost.
Drone truck delivery supports a number of features, including:
-
Define various drone types by payload, speed and battery
-
Assign drone types to ground vehicles as potential companions in performing delivery
-
Allow for fixed and linear endurance models to determine the effective flight range
-
Overwrite point to point flight distance and time with transit matrix
See Modeling drones.
Driver scheduling enhancements
New inputs have been added to improve control over the Driver Scheduling problem type in Transportation Optimization:
-
Driver Availability - Use this new input table to define the number of drivers per driver class available at a site. You can also constrain the time window for which the driver class is available.
-
Routes - The Asset Origin column has been added to this input table to identify where the transportation assets originate for driver scheduling. This value is now populated in a number of output tables when the model is solved.
A new Driver Utilization output table provides a summary of drivers available and used per site - driver class combination.
Closing Cost data type change
The data type for the Fixed Closing Cost column in the Sites, Sites Multi-Period, Work Centers, and Work Centers Multi-Period tables has been changed from float to text. This change is to support the use of currencies when defining the closing cost.
Map performance improvements
Map display performance has been updated to use batched requests. This helps to prevent the display of the map layer and associated table grid from timing out with large numbers of records.
Updated default value for Post Process Random Lead Time
The default for the Post Process Random Lead Time option on the Safety Stock Optimization Advanced tab in Inventory Optimization options has been changed from unchecked (off) to checked (on). This applies to new models and existing models where you have never set the option. If you have manually set the option, the value will not be changed during model upgrade. Most IO models have lead time variation, so it is typically expected that the option should be selected. This change ensures that you actively turn it off if not needed.
Tables handled during NO-IO Conversion
NO-IO Conversion handles the following tables during the model transformation:
Products, Sites, Customers, Periods, Modes, Bills of Material, Bill of Material Assignments, Customer Orders, Customer Demand, User Defined Customer Forecast Profile, User Defined Site Forecast Profile, Production Policies, Inventory Policies, Site Sourcing Policies, Customer Sourcing Policies, Transportation Policies, Transit Matrix, Group Members, Options.
For this release, tables were added in addition to those handled in the previous release. These specific tables are:
-
User Defined Customer Forecast Profile
-
User Defined Site Forecast Profile
-
Transit Matrix
The actual Groups are not copied into the destination model. Group members are used when interpreting the NO output. Options is an internal table that stores model and solver run options.
Multi-period models are treated as single period models after conversion to prevent all demand from being "extremely slow". While Periods are handled during conversion, multi-period tables, such as Sites Multi-Period, are not brought into the new model.
Getting Started page updates
Links on the Modeler Getting Started page have been updated to correctly reflect the locations for Coupa University and the Coupa Support Portal.
Input Tables
|
Table |
Column |
Description of Change |
Model Database Table Name |
Model Database Column Name |
Data Type |
Required |
|---|---|---|---|---|---|---|
|
Input Tables |
||||||
|
Drones |
Name |
New table/column |
DroneType |
DroneTypeName |
Text |
Yes |
|
Max Flight Time |
New table/column |
DroneType |
Range |
Text |
No |
|
|
Battery Capacity |
New table/column |
DroneType |
BatteryCapacity |
Float |
No |
|
|
Consumption Rate |
New table/column |
DroneType |
PerDistanceConsumptionRate |
Float |
No |
|
|
Empty Load Consumption Rate |
New table/column |
DroneType |
PerRepositionDistanceConsumptionRate |
Float |
No |
|
|
Speed |
New table/column |
DroneType |
Speed |
Text |
No |
|
|
Capacity (Quantity) |
New table/column |
DroneType |
MaxQty |
Text |
No |
|
|
Capacity (Weight) |
New table/column |
DroneType |
MaxWeight |
Text |
No |
|
|
Capacity (Volume) |
New table/column |
DroneType |
MaxCubic |
Text |
No |
|
|
Minimum Capacity (Quantity) |
New table/column |
DroneType |
MinQty |
Text |
No |
|
|
Minimum Capacity (Weight) |
New table/column |
DroneType |
MinWeight |
Text |
No |
|
|
Minimum Capacity (Volume) |
New table/column |
DroneType |
MinCubic |
Text |
No |
|
|
Fixed Launch Time |
New table/column |
DroneType |
FixedLaunchTime |
Text |
No |
|
|
Fixed Service Time |
New table/column |
DroneType |
FixedServiceTime |
Text |
No |
|
|
Fixed Retrieval Time |
New table/column |
DroneType |
FixedRetrievalTime |
Text |
No |
|
|
Fixed Drone Cost |
New table/column |
DroneType |
FixedDroneCost |
Text |
No |
|
|
Status |
New table/column |
DroneType |
Status |
Text |
No |
|
|
Drone Assignments |
Carrier |
New table/column |
DroneTruckPairing |
DroneCarrierName |
Text |
Yes |
|
Drone Type |
New table/column |
DroneTruckPairing |
DroneTypeName |
Text |
Yes |
|
|
Available Units |
New table/column |
DroneTruckPairing |
AvailableQty |
Integer |
Yes |
|
|
Status |
New table/column |
DroneTruckPairing |
Status |
Text |
No |
|
|
Drone Transit Override |
Origin |
New table/column |
DroneTransitOverride |
OriginName |
Text |
Yes |
|
Destination |
New table/column |
DroneTransitOverride |
DestinationName |
Text |
Yes |
|
|
Travel Time |
New table/column |
DroneTransitOverride |
TravelTime |
Text |
No |
|
|
Travel Distance |
New table/column |
DroneTransitOverride |
TravelDistance |
Text |
No |
|
|
Drone Type |
New table/column |
DroneTransitOverride |
DroneTypeName |
Text |
Yes |
|
|
Is Symmetric |
New table/column |
DroneTransitOverride |
IsSymmetric |
Boolean |
No |
|
|
Status |
New table/column |
DroneTransitOverride |
Status |
Text |
No |
|
|
Sites |
Drone Eligible |
New column |
Sites |
IsDroneEligible |
Boolean |
Yes |
|
Customers |
Drone Eligible |
New column |
Customers |
IsDroneEligible |
Boolean |
Yes |
|
Driver Availability |
Site Name |
New table/column |
DriverAvailability |
SiteName |
Text |
Yes |
|
Driver Class |
New table/column |
DriverAvailability |
DriverClass |
Text |
Yes |
|
|
Available Quantity |
New table/column |
DriverAvailability |
AvailableQty |
Int |
Yes |
|
|
Minimum Quantity |
New table/column |
DriverAvailability |
MinimumQty |
Int |
No |
|
|
Start Date Time |
New table/column |
DriverAvailability |
StartDateTime |
DateTime |
No |
|
|
End Date Time |
New table/column |
DriverAvailability |
EndDateTime |
DateTime |
No |
|
|
Status |
New table/column |
DriverAvailability |
Status |
Text |
No |
|
|
Drivers |
Available Quantity |
Removed column (use Available Quantity in Driver Availability) |
Driver |
AvailableQuantity |
NA |
NA |
|
Allowed Assets |
Renamed column (previously Allowed Equipment) |
Driver |
AllowedEquipment |
Text |
Yes |
|
|
Fixed Cost |
Change in Required |
Driver |
FixedCost |
Text |
Yes |
|
|
Routes |
Asset Origin |
New column |
Routes |
AssetOrigin |
Text |
Yes |
|
Asset Name |
Renamed column (previously Equipment Type |
Routes |
EquipmentType |
Text |
Yes |
|
|
Sites |
Fixed Closing Cost |
Changed data type (Float to Text) |
Sites |
SiteClosingCost |
Text |
No |
|
Sites Multi-Period |
Fixed Closing Cost |
Changed data type (Float to Text) |
Sites_MultiPeriod |
SiteClosingCost |
Text |
No |
|
Work Centers |
Fixed Closing Cost |
Changed data type (Float to Text) |
WorkCenters |
WorkCenterClosingCost |
Text |
No |
|
Work Centers Multi-Period |
Fixed Closing Cost |
Changed data type (Float to Text) |
WorkCenters_MultiPeriod |
WorkCenterClosingCost |
Text |
No |
|
Customer Demand |
Periods Allowed Early |
New column |
CustomerDemand |
PeriodsAllowedEarly |
Text |
No |
|
Early Delivery Penalty Cost |
New column |
CustomerDemand |
EarlyDeliveryPenaltyCost |
Text |
No |
|
|
Early Delivery Penalty Cost Basis |
New column |
CustomerDemand |
EarlyDeliveryPenaltyCostBasis |
Text |
No |
|
|
Early Delivery Cost Inflation Factor |
New column |
CustomerDemand |
EarlyDeliveryCostInflationFactor |
Float |
No |
|
|
Periods Allowed Late |
New column |
CustomerDemand |
PeriodsAllowedLate |
Text |
No |
|
|
Late Delivery Penalty Cost |
New column |
CustomerDemand |
LateDeliveryPenaltyCost |
Text |
No |
|
|
Late Delivery Penalty Cost Basis |
New column |
CustomerDemand |
LateDeliveryPenaltyCostBasis |
Text |
No |
|
|
Late Delivery Cost Inflation Factor |
New column |
CustomerDemand |
LateDeliveryCostInflationFactor |
Float |
No |
|
|
Single Source Fulfillment |
New column Read-only |
CustomerDemand |
SingleSourceFulfillment |
Boolean |
No |
|
|
Single Period Fulfillment |
New column Read-only |
CustomerDemand |
SinglePeriodFulfillment |
Boolean |
No |
|
|
Fulfillment ID |
New column |
CustomerDemand |
FulfillmentID |
Text |
No |
|
|
Customer Orders |
Periods Allowed Early |
New column |
CustomerDemand |
TimeAllowedEarly |
Text |
No |
|
Early Delivery Penalty Cost |
New column |
CustomerDemand |
EarlyDeliveryPenaltyCost |
Text |
No |
|
|
Early Delivery Penalty Cost Basis |
New column |
CustomerDemand |
EarlyDeliveryPenaltyCostBasis |
Text |
No |
|
|
Early Delivery Cost Inflation Factor |
New column |
CustomerDemand |
EarlyDeliveryCostInflationFactor |
Float |
No |
|
|
Periods Allowed Late |
New column |
CustomerDemand |
TimeAllowedLate |
Text |
No |
|
|
Late Delivery Penalty Cost |
New column |
CustomerDemand |
LateDeliveryPenaltyCost |
Text |
No |
|
|
Late Delivery Penalty Cost Basis |
New column |
CustomerDemand |
LateDeliveryPenaltyCostBasis |
Text |
No |
|
|
Late Delivery Cost Inflation Factor |
New column |
CustomerDemand |
LateDeliveryCostInflationFactor |
Float |
No |
|
|
Single Source Fulfillment |
New column Read-only |
CustomerDemand |
SingleSourceFulfillment |
Boolean |
No |
|
|
Single Period Fulfillment |
New column Read-only |
CustomerDemand |
SinglePeriodFulfillment |
Boolean |
No |
|
|
Fulfillment ID |
New column |
CustomerDemand |
FulfillmentID |
Text |
No |
|
|
Customer Order Fulfillment
|
Fulfillment ID |
New column Read-only |
CustomerOrderFulfillment |
FulfillmentID |
Text |
Yes |
|
Single Source Fulfillment |
New column Read-only |
CustomerOrderFulfillment |
SingleSourceFulfillment |
Boolean |
Yes |
|
|
Single Period Fulfillment |
New column Read-only |
CustomerOrderFulfillment |
SinglePeriodFulfillment |
Boolean |
Yes |
|
Output Tables
|
Table |
Column |
Description of Change |
Model Database Table Name |
Model Database Column Name |
Data Type |
|---|---|---|---|---|---|
|
Output Tables |
|||||
|
Transportation Drone Summary |
Carrier |
New table/column |
DroneUtilizations |
DroneCarrierName |
Text |
|
Drone |
New table/column |
DroneUtilizations |
DroneTypeName |
Text |
|
|
Drones Available |
New table/column |
DroneUtilizations |
NumOfDronesAvailable |
Int |
|
|
Drones Used |
New table/column |
DroneUtilizations |
NumOfUsedDrones |
Int |
|
|
Scenario ID |
New table/column |
DroneUtilizations |
ScenarioID |
Int |
|
|
Sub-Scenario ID |
New table/column |
DroneUtilizations |
StepNumber |
Int |
|
|
Sortie Summary |
Drone |
New table/column |
SortieOutput |
DroneTypeName |
Text |
|
Route ID |
New table/column |
SortieOutput |
RouteId |
Text |
|
|
Total Distance |
New table/column |
SortieOutput |
TotalDistance |
Float |
|
|
Total Weight |
New table/column |
SortieOutput |
TotalWeight |
Float |
|
|
Total Volume |
New table/column |
SortieOutput |
TotalCubic |
Float |
|
|
Total Quantity |
New table/column |
SortieOutput |
TotalQty |
Float |
|
|
Start Date Time |
New table/column |
SortieOutput |
StartDateTime |
DateTime |
|
|
End Date Time |
New table/column |
SortieOutput |
EndDateTime |
DateTime |
|
|
Total Time |
New table/column |
SortieOutput |
TotalTime |
Float |
|
|
Travel Time |
New table/column |
SortieOutput |
TravelTime |
Float |
|
|
Service Time |
New table/column |
SortieOutput |
ServiceTime |
Float |
|
|
Wait Time |
New table/column |
SortieOutput |
WaitTime |
Float |
|
|
Start Date Time Local |
New table/column |
SortieOutput |
StartDateTimeLocal |
DateTime |
|
|
End Date Time Local |
New table/column |
SortieOutput |
EndDateTimeLocal |
DateTime |
|
|
Max Weight |
New table/column |
SortieOutput |
MaxWeight |
Float |
|
|
Max Volume |
New table/column |
SortieOutput |
MaxCubic |
Float |
|
|
Max Quantity |
New table/column |
SortieOutput |
MaxQty |
Float |
|
|
Drone ID |
New table/column |
SortieOutput |
DroneId |
Int |
|
|
Sortie Sequence ID |
New table/column |
SortieOutput |
SortieSequenceId |
Int |
|
|
Sortie Utilization |
New table/column |
SortieOutput |
SortieUtilization |
Float |
|
|
Scenario ID |
New table/column |
SortieOutput |
ScenarioID |
Int |
|
|
Sub-Scenario ID |
New table/column |
SortieOutput |
StepNumber |
Int |
|
|
Sortie Details |
Drone |
New table/column |
SortieDetails |
DroneTypeName |
Text |
|
Drone ID |
New table/column |
SortieDetails |
DroneId |
Int |
|
|
Sortie ID |
New table/column |
SortieDetails |
SortieId |
Int |
|
|
Gantt ID |
New table/column |
SortieDetails |
GanttId |
Int |
|
|
Start Location |
New table/column |
SortieDetails |
StartLocationName |
Text |
|
|
End Location |
New table/column |
SortieDetails |
EndLocationName |
Text |
|
|
Activity Type |
New table/column |
SortieDetails |
ActivityType |
Text |
|
|
Activity Start Time |
New table/column |
SortieDetails |
ActivityStartDateTime |
DateTime |
|
|
Activity End Time |
New table/column |
SortieDetails |
ActivityEndDateTime |
DateTime |
|
|
Distance |
New table/column |
SortieDetails |
Distance |
Float |
|
|
Cumulative Distance |
New table/column |
SortieDetails |
CumulativeDistance |
Float |
|
|
Activity Time |
New table/column |
SortieDetails |
ActivityTime |
Float |
|
|
Cumulative Time |
New table/column |
SortieDetails |
CumulativeTime |
Float |
|
|
Load Unload Quantity |
New table/column |
SortieDetails |
LoadUnloadQty |
Float |
|
|
Load Unload Weight |
New table/column |
SortieDetails |
LoadUnloadWeight |
Float |
|
|
Load Unload Volume |
New table/column |
SortieDetails |
LoadUnloadCubic |
Float |
|
|
Load Unload Shipment Count |
New table/column |
SortieDetails |
LoadUnloadShipmentCount |
Int |
|
|
Total Quantity |
New table/column |
SortieDetails |
TotalQty |
Float |
|
|
Total Weight |
New table/column |
SortieDetails |
TotalWeight |
Float |
|
|
Total Volume |
New table/column |
SortieDetails |
TotalCubic |
Float |
|
|
Total Shipment Count |
New table/column |
SortieDetails |
TotalShipmentCountOnAsset |
Int |
|
|
Remaining Quantity Capacity |
New table/column |
SortieDetails |
RemainingQtyCapacity |
Float |
|
|
Remaining Weight Capacity |
New table/column |
SortieDetails |
RemainingWeightCapacity |
Float |
|
|
Remaining Volume Capacity |
New table/column |
SortieDetails |
RemainingCubicCapacity |
Float |
|
|
Start Location Latitude |
New table/column |
SortieDetails |
StartLocationLatitude |
Float |
|
|
Start Location Longitude |
New table/column |
SortieDetails |
StartLocationLongitude |
Float |
|
|
End Location Latitude |
New table/column |
SortieDetails |
EndLocationLatitude |
Float |
|
|
End Location Longitude |
New table/column |
SortieDetails |
EndLocationLongitude |
Float |
|
|
Activity Start Time Local |
New table/column |
SortieDetails |
StartDateTimeLocal |
DateTime |
|
|
Activity End Time Local |
New table/column |
SortieDetails |
EndDateTimeLocal |
DateTime |
|
|
Scenario ID |
New table/column |
SortieDetails |
ScenarioID |
Int |
|
|
Sub-Scenario ID |
New table/column |
SortieDetails |
StepNumber |
Int |
|
|
Sortie Segments |
Start Date Time |
New table/column |
SortieSegmentOutput |
StartDateTime |
DateTime |
|
End Date Time |
New table/column |
SortieSegmentOutput |
EndDateTime |
DateTime |
|
|
Distance |
New table/column |
SortieSegmentOutput |
Distance |
Float |
|
|
Flight Time |
New table/column |
SortieSegmentOutput |
FlightTime |
Float |
|
|
Start Date Time Local |
New table/column |
SortieSegmentOutput |
StartDateTimeLocal |
DateTime |
|
|
End Date Time Local |
New table/column |
SortieSegmentOutput |
EndDateTimeLocal |
DateTime |
|
|
Sortie ID |
New table/column |
SortieSegmentOutput |
SortieId |
Int |
|
|
Sequence ID |
New table/column |
SortieSegmentOutput |
SequenceId |
Int |
|
|
Start Stop ID |
New table/column |
SortieSegmentOutput |
StartStopId |
Int |
|
|
End Stop ID |
New table/column |
SortieSegmentOutput |
EndStopId |
Int |
|
|
Scenario ID |
New table/column |
SortieSegmentOutput |
ScenarioID |
Int |
|
|
Sub-Scenario ID |
New table/column |
SortieSegmentOutput |
StepNumber |
Int |
|
|
Sortie Stops |
Stop ID |
New table/column |
SortieStopOutput |
StopId |
Int |
|
Sortie ID |
New table/column |
SortieStopOutput |
SortieId |
Int |
|
|
Sequence ID |
New table/column |
SortieStopOutput |
SequenceId |
Int |
|
|
Site Name |
New table/column |
SortieStopOutput |
LocationName |
Int |
|
|
Arrival Date Time |
New table/column |
SortieStopOutput |
ArriveDateTime |
DateTime |
|
|
Delivery Date Time |
New table/column |
SortieStopOutput |
DeliveryDateTime |
DateTime |
|
|
Leave Date Time |
New table/column |
SortieStopOutput |
LeaveDateTime |
DateTime |
|
|
Latitude |
New table/column |
SortieStopOutput |
Latitude |
Float |
|
|
Longitude |
New table/column |
SortieStopOutput |
Longitude |
Float |
|
|
Stop Type |
New table/column |
SortieStopOutput |
StopType |
Text |
|
|
Pickup Volume |
New table/column |
SortieStopOutput |
PickupCubic |
Float |
|
|
Pickup Weight |
New table/column |
SortieStopOutput |
PickupWeight |
Float |
|
|
Pickup Quantity |
New table/column |
SortieStopOutput |
PickupQuantity |
Float |
|
|
Delivered Volume |
New table/column |
SortieStopOutput |
DeliveredCubic |
Float |
|
|
Delivered Weight |
New table/column |
SortieStopOutput |
DeliveredWeight |
Float |
|
|
Delivered Quantity |
New table/column |
SortieStopOutput |
DeliveredQuantity |
Float |
|
|
Remaining Volume |
New table/column |
SortieStopOutput |
RemainingCubic |
Float |
|
|
Remaining Weight |
New table/column |
SortieStopOutput |
RemainingWeight |
Float |
|
|
Remaining Quantity |
New table/column |
SortieStopOutput |
RemainingQuantity |
Float |
|
|
Arrival Date Time Local |
New table/column |
SortieStopOutput |
ArriveDateTimeLocal |
DateTime |
|
|
Delivery Date Time Local |
New table/column |
SortieStopOutput |
DeliveryDateTimeLocal |
DateTime |
|
|
Leave Date Time Local |
New table/column |
SortieStopOutput |
LeaveDateTimeLocal |
DateTime |
|
|
Range At Arrival |
New table/column |
SortieStopOutput |
RangeAtArrival |
Float |
|
|
Range When Leaving |
New table/column |
SortieStopOutput |
RangeWhenLeaving |
Float |
|
|
Scenario ID |
New table/column |
SortieStopOutput |
ScenarioID |
Int |
|
|
Sub-Scenario ID |
New table/column |
SortieStopOutput |
StepNumber |
Int |
|
|
Transportation Summary |
Total Sortie Cost |
New column |
VehicleRouteOptimizationSummary |
TotalSortieCost |
Money |
|
Total Sorties |
New column |
VehicleRouteOptimizationSummary |
TotalSorties |
Int |
|
|
Total Drones |
New column |
VehicleRouteOptimizationSummary |
TotalDrones |
Int |
|
|
Total Sortie Stops |
New column |
VehicleRouteOptimizationSummary |
TotalSortieStops |
Int |
|
|
Sortie Utilization |
New column |
VehicleRouteOptimizationSummary |
SortieUtilization |
Float |
|
|
Route Summary |
Drone Fixed Cost |
New column |
VRPOutputRoutes |
DroneFixedCost |
Money |
|
Asset Origin |
New column |
VRPOutputRoutes |
AssetOrigin |
Text |
|
|
Driver Utilization |
Site Name |
New table/column |
DriverUtilitization |
SiteName |
Text |
|
Driver Class |
New table/column |
DriverUtilitization |
DriverClass |
Text |
|
|
Available Quantity |
New table/column |
DriverUtilitization |
AvailableQuantity |
Int |
|
|
Quantity Used |
New table/column |
DriverUtilitization |
QuantityUsed |
Int |
|
|
Scenario ID |
New table/column |
DriverUtilitization |
ScenarioID |
Int |
|
|
Sub-Scenario ID |
New table/column |
DriverUtilitization |
StepNumber |
Int |
|
|
Driver Summary |
Site Name |
New column |
DriverSummary |
SiteName |
Text |
|
Driver Schedule |
Asset Origin |
New column |
DriverSchedule |
Asset Origin |
Text |
|
Unscheduled Routes |
Asset Origin |
New column |
UnscheduledRoutes |
AssetOrigin |
Text |
|
Asset Name |
Renamed column (previously Equipment Type ID) |
UnscheduledRoutes |
EquipmentTypeId |
Text |
|
|
Network Summary |
% Demand On-Time |
New column |
OptimizationOutputNetworkSummary |
PercentDemandOnTime |
Float |
|
% Demand Late |
New column |
OptimizationOutputNetworkSummary |
PercentDemandLate |
Float |
|
|
% Demand Early |
New column |
OptimizationOutputNetworkSummary |
PercentDemandEarly |
Float |
|
|
Total Late Demand Penalty Cost |
New column |
OptimizationOutputNetworkSummary |
TotalLateDemandPenaltyCost |
Money |
|
|
Total Early Demand Penalty Cost |
New column |
OptimizationOutputNetworkSummary |
TotalEarlyDemandPenaltyCost |
Money |
|
|
Total Unserved Demand Penalty Cost |
New column |
OptimizationOutputNetworkSummary |
TotalUnservedDemandPenaltyCost |
Money |
|
|
Total Demand Penalty Cost |
New column |
OptimizationOutputNetworkSummary |
TotalDemandPenaltyCost |
Money |
|
|
Financial Summary |
Total Late Demand Penalty Cost |
New column |
OptimizationOutputFinancialSummary |
TotalLateDemandPenaltyCost |
Money |
|
Total Early Demand Penalty Cost |
New column |
OptimizationOutputFinancialSummary |
TotalEarlyDemandPenaltyCost |
Money |
|
|
Total Unserved Demand Penalty Cost |
New column |
OptimizationOutputFinancialSummary |
TotalUnservedDemandPenaltyCost |
Money |
|
|
Total Demand Penalty Cost |
New column |
OptimizationOutputFinancialSummary |
TotalDemandPenaltyCost |
Money |
|
|
Network Organization Summary |
% Demand On-Time |
New column |
OptimizationOutputOrganizationSummary |
PercentDemandOnTime |
Float |
|
% Demand Late |
New column |
OptimizationOutputOrganizationSummary |
PercentDemandLate |
Float |
|
|
% Demand Early |
New column |
OptimizationOutputOrganizationSummary |
PercentDemandEarly |
Float |
|
|
Total Late Demand Penalty Cost |
New column |
OptimizationOutputOrganizationSummary |
TotalLateDemandPenaltyCost |
Money |
|
|
Total Early Demand Penalty Cost |
New column |
OptimizationOutputOrganizationSummary |
TotalEarlyDemandPenaltyCost |
Money |
|
|
Total Unserved Demand Penalty Cost |
New column |
OptimizationOutputOrganizationSummary |
TotalUnservedDemandPenaltyCost |
Money |
|
|
Total Demand Penalty Cost |
New column |
OptimizationOutputOrganizationSummary |
TotalDemandPenaltyCost |
Money |
|
|
Network Customer Summary |
% Demand On-Time |
New column |
OptimizationOutputCustomerSummary |
PercentDemandOnTime |
Float |
|
% Demand Late |
New column |
OptimizationOutputCustomerSummary |
PercentDemandLate |
Float |
|
|
% Demand Early |
New column |
OptimizationOutputCustomerSummary |
PercentDemandEarly |
Float |
|
|
Total Late Demand Penalty Cost |
New column |
OptimizationOutputCustomerSummary |
TotalLateDemandPenaltyCost |
Money |
|
|
Total Early Demand Penalty Cost |
New column |
OptimizationOutputCustomerSummary |
TotalEarlyDemandPenaltyCost |
Money |
|
|
Total Unserved Demand Penalty Cost |
New column |
OptimizationOutputCustomerSummary |
TotalUnservedDemandPenaltyCost |
Money |
|
|
Total Demand Penalty Cost |
New column |
OptimizationOutputCustomerSummary |
TotalDemandPenaltyCost |
Money |
|
|
Network Product Summary |
% Demand On-Time |
New column |
OptimizationOutputProductSummary |
PercentDemandOnTime |
Float |
|
% Demand Late |
New column |
OptimizationOutputProductSummary |
PercentDemandLate |
Float |
|
|
% Demand Early |
New column |
OptimizationOutputProductSummary |
PercentDemandEarly |
Float |
|
|
Total Late Demand Penalty Cost |
New column |
OptimizationOutputProductSummary |
TotalLateDemandPenaltyCost |
Money |
|
|
Total Early Demand Penalty Cost |
New column |
OptimizationOutputProductSummary |
TotalEarlyDemandPenaltyCost |
Money |
|
|
Total Unserved Demand Penalty Cost |
New column |
OptimizationOutputProductSummary |
TotalUnservedDemandPenaltyCost |
Money |
|
|
Total Demand Penalty Cost |
New column |
OptimizationOutputProductSummary |
TotalDemandPenaltyCost |
Money |
|
|
Customer Demand Summary
|
Fulfillment ID |
New column |
OptimizationOutputAggregatedDemand |
OrderID |
Text |
|
Priority |
New column |
OptimizationOutputAggregatedDemand |
Priority |
Text |
|
|
Demanded Period |
New column |
OptimizationOutputAggregatedDemand |
DemandedPeriod |
Integer |
|
|
Periods Late |
New column |
OptimizationOutputAggregatedDemand |
PeriodsLate |
Integer |
|
|
Periods Early |
New column |
OptimizationOutputAggregatedDemand |
PeriodsEarly |
Integer |
|
|
Remaining Demand Quantity |
New column |
OptimizationOutputAggregatedDemand |
ReaminingDemandQuantity |
Float |
|
|
Late Demand Penalty Cost |
New column |
OptimizationOutputAggregatedDemand |
LateDemandPenaltyCost |
Money |
|
|
Early Demand Penalty Cost |
New column |
OptimizationOutputAggregatedDemand |
EarlyDemandPenaltyCost |
Money |
|
|
Total Unserved Demand Penalty Cost |
New column |
OptimizationOutputAggregatedDemand |
TotalUnservedDemandPenaltyCost |
Money |
|
|
Total Demand Penalty Cost |
Renamed column (from Total Demand Penalty) |
OptimizationOutputAggregatedDemand |
TotalDemandPenaltyCost |
Money |
|
|
Received Period |
Renamed column (from Period No) |
OptimizationOutputAggregatedDemand |
PeriodNo |
Integer |
|
Home page features
Model Building
Run recipe flyout update
The recipe name has been added to the Run Recipe flyout indicating which recipe is to be run
Data Management
Upload Data for Decision Data Models
Data Management now includes the ability to upload CSV files to DDMs in the Data Viewer.
Database Extension for Decision Data Models
Decision Data Models can now be expanded to include additional tables and columns. Adding columns to existing tables allows you to customize your DDM to include additional metadata which is not already available in the DDM structure. Adding tables to your DDM provides additional content for use within the SCDP platform (for example, adding lookup tables for macros). Extension columns are supported across the platform.
Preview During Dynamic View Creation
A new Preview tab will be added to the Dynamic View editor to enable you to quickly see the results of your dynamic views. This will help you validate that you have set up a view correctly. Previously, you had to create an App Studio app board for every view you wanted to preview, which required access to App Studio.
Duplicating Dynamic Views
You will now be able to duplicate an existing dynamic view. You can then use this duplicated view as a starting point for a new view.
Macros
Using the Snap Grid
A new Snap Grid button has been added to the design surface to enable you to show or hide a grid on the design surface. Now, you can easily snap a grid to the design surface.
Using the Zoom Slider
A new Zoom Level Slider has been added to the design surface to enable you to easily zoom in and out of the design surface. Now, you can quickly zoom in and out to better navigate the design surface.
Copy and Paste a Macro Action
The ability to copy a macro action has been added while working on the macro. This will save time if you need to insert similar actions into another macro with small changes for each action.
Addition of CountZ and CountAllZ Functions
The CountZ and CountAllZ functions have been added to the system. The CountZ and CountAllZ functions are the similar to the Count and CountAll functions, except that nulls are treated as zero.
Statement Editor Update
For auto incremented columns and computed columns, the Statement Editor is unavailable. These types of columns are computed automatically by the system.
Excel Import Action Update
The ability to specify that all empty cells are treated as null or default empty values has been added to Excel Import Action.
Queue Management
Auto refresh
A checkbox has been added to Queue Management that lets you enable an auto refresh of the grid contents. When enabled, the grid refreshes every few seconds.
Paging controls
Queue Management supports controls that let you set the page size of the grid and navigate to a specific page.
Refresh logs
A Refresh Logs button has been added to the Logs tab in Queue Management. Use this button when a queue item is running to display the latest log information.
Supply Chain API
New endpoints
- GET /v4/dataset/{datasetId}/collection/{collection}/record/pointer
Returns data from a dataset collection, given the dataset ID and the collection name. Pass paging size and the index key with the request to retrieve data from any key of the collection.
- GET /v4/model/{modelId}/table/{tableName}/record/pointer
Returns data from a table in a model by the model ID. Pass paging size and index key with the request to retrieve data from any key of the table.
App Studio and Macros
Preview During Dynamic View Creation
A new Preview tab will be added to the Dynamic View editor to enable you to quickly see the results of your dynamic views. This will help you validate that you have set up a view correctly. Previously, you had to create an App Studio app board for every view you wanted to preview, which required access to App Studio.
Duplicating Dynamic Views
You will now be able to duplicate an existing dynamic view. You can then use this duplicated view as a starting point for a new view.
Macros
Unique icons added for each Macros action
The following macro actions will now have unique icons to help identify them on the Macros workspace:
-
Insert

-
Update

-
Delete

-
Scalar Query

-
Excel Export

-
Excel Import

-
DA Model

New RowNumber function added to Statement Editor
A new window function called RowNumber will be added to the Statement Editor. This function returns the sequential number of a row within a partition of a result set, starting at 1 for the first row in each partition. It can be used with all data types.
RowNumber will work similarly to the Rank and DenseRank functions. It must be used with the OrderBy function and optionally can use the PartitionBy function.
New ToDateTime() conversion function
The ToDateTime() function has been added to the Statement Editor. This function converts the value to its left to a date. It is available for Float, Integer, and String data types.
Culture parameter added to conversion functions
All conversion functions will now include a Culture parameter. This change has been made to the conversion functions provided in the Statement Editor:
-
ToString()
-
ToFloat()
-
ToInteger()
-
ToDateTime()
The Culture parameter allows you to specify the formatting used to display the data according to the locale of the users (for example, whether decimal values use a comma or a period). Valid values for the Culture parameter are pulled from .NET’s list of available culture codes. When you edit the function using the Statement Editor interface, a number of commonly used values will display when you click in the Culture field. You can select a value or type the value you need. You can also add the Culture value using the Statement Text Editor.
To ensure backwards compatibility, if no Culture is specified then the function will use the current locale, which either comes from the user’s browser or the (also optional) locale in the LLAPI call that started the macro. In addition, the conversion is performed using the CAST() function. This is the pre-existing functionality.
Formatting with the ToString() function
The ToString() function has been enhanced to include a Formatting parameter. This parameter allows the user to specify the formatting of the resulting string.
In the ToString() function, the interaction of the Formatting and Culture parameters is as follows:
-
If you omit both parameters, a default conversion to a string using the CAST() function is used. This is the existing functionality and is done for backwards compatibility.
-
If only Format is specified, then it is used and Culture defaults to the culture from the browser or LLAPI Culture value. Note that this is a .NET format string.
-
If only Culture is specified, the format defaults based on the data type. For float types, we recommend F2 or similar.
-
If both Format and Culture are specified, they are both used.
Improved entry of function parameters in Statement Editor
When a parameter in the Statement Editor is a simple string constant and not a longer expression, the Statement Editor will now provide a toggle to switch between entering the parameter value in a text field, or selecting from a dropdown list.
Function reference help improved
The Statement Editor function reference in the help has been expanded and improved. This includes more use cases and more information about using functions together.
Modeler
Platform support for model versions
The Supply Chain platform supports models with a database schema of up to 1 year old. As of release 35.0.0, this includes models from releases back to the R30 release (schema version 303007). Models with unsupported schemas must be upgraded prior to solving, modeling, using with apps or solving on the cloud. Support is ending for the following schema versions:
-
302000 (Release 2020.09)
-
303001 (Release 2020.12)
Model options
You now have access to model options that control a number of features in your model. The options include:
-
General - model horizon, inventory carrying cost, model culture and others.
-
Scenario - define an alternate name for the Baseline scenario.
-
Units and Currency - default values for units of measure (such as weight and distance) and currency.
Model Options are located in the Model Actions menu to the left of the Launch Pad button.
Input table validation
Modeler supports validation of data in input tables, in cases such as columns that use a specific set of accepted values or values from another table. You can validate an individual table, or validate all input tables in the model. When validation is complete, invalid values are highlighted and the rows containing invalid values are flagged. You can apply a filter to display only those records with invalid values or those with no invalid values. In the input table navigation pane, tables with records that have invalid values are flagged, as are the groups to which the input tables belong.
Spatial modeling
Network Optimization includes the capability to model space within sites, enabling you to determine site size based on dimensional requirements (floor area). You can define spaces to align with specific functions within the location, such as storage, shipping and offices. The space definitions include fixed and variable costs and CO2 consumption rates. They also capture inventory considerations and overall constraints, such as minimum and maximum expansion limits.
Spatial modeling supports a number of features, including:
-
Assess sites based on available space with associated costs for startup and operating expenses.
-
Allow for variable space usage based on the activity in the space, including minimum and maximum allowances based on throughput of specific products.
-
Constrain sites and spaces by the total allowable space.
-
Expand sites and spaces while considering expansion costs and increased operating costs and CO2 consumption.
-
Define obsolete/unhealthy stock as a quantity or as a percentage of "healthy" stock at the site-product level.
In addition to the space and inventory features, general site cost and CO2 consumption features are available:
-
Define startup costs and fixed CO2 consumption for sites at the period level.
-
Define variable costs and CO2 consumption at the site level.
A set of new input tables provides the means for defining the spaces per site and assigning products that can utilize the space. Please note that at this time, groups are not supported for the Space column in the space assignments tables. Additional columns in the existing sites tables enable you to constrain spaces at the site level, while columns in the inventory policies tables provide a way to define obsolete/unhealthy inventory. New output tables and additional columns in existing output tables provide thorough reporting including cost and CO2 data, space utilization and expansion, and inventory metrics.
Driver scheduling in Transportation Optimization
Once you have run Transportation Optimization to produce routes, you can use driver scheduling to assign a sequence of routes to specific drivers, minimizing costs within the applicable constraints. Drivers are defined using driver classes, which determine the equipment types the driver supports, the scheduling constraints for the driver, such as maximum duty time per shift and maximum distance per driver, and the cost associated with the scheduling of the specific driver.
This feature includes new input tables:
-
Drivers - Use this table to create records for each driver class. Apply constraints to limit conditions such as the allowable equipment types, number of routes, distance and working hours for the driver. You can also define fixed and variable costs that are incurred for this driver class.
-
Routes - Use this table to identify the existing routes to which you want drivers assigned. The routes are those returned by the Transportation Optimization solver.
You can review the driver scheduling results in the following new output tables:
-
Driver Schedule - This table displays the driver assignment per route, along with details such as the equipment used and the total route distance.
-
Driver Scheduling Summary - This table provides a high-level summary of the number of scheduled and unscheduled routes, with the total cost, number of drivers and other metrics.
-
Driver Summary - This table provides metrics per driver class, such as the number of routes assigned, total cost and total distance.
-
Unscheduled Routes - This table identifies routes that could not be scheduled with a specific driver.
To run driver scheduling, select "Transportation Optimization" as the Technology and "Driver Scheduling" as the Problem Type on the Launch Pad.
Scenario item enhancements
You can now create and edit filters from within scenario items. These filters will be available in the input tables for which they were defined as well as in scenario items that use the specific table.
The field where you define the value for your scenario item now reflects the type of column selected. For example, if the column supports domain values, such as the groups, filters and individual values, these are available for selection in a dropdown list. Other supported column types include datetime (date picker is provided), boolean (Yes/No values only), integer and double (correctly formatted numbers only).
Model expansion
You can create a new model based on the expansion of any scenario in the model you select. You can use the expanded model to verify that your groups and scenario items are defined and working correctly. Model expansion does the following:
- Creates all individual records based on grouped records. For example, if your Transportation Policies were defined with a group for the Destination Name, the expanded model will have one Transportation Policies record for each member of the group.
- Applies the scenario items for the selected scenario. For example, if the scenario you select to expand excludes one or more sites, those sites (and any records that depended on those sites) will not be in the expanded model.
- Applies input pipes that use internal tables as data sources and populates records with the input pipe data. For example, if you have defined an input pipe to populate the Unit Sourcing Cost in Site Sourcing Policies, the expanded model with have the values populated in that column (rather than the input pipe name).
You can select Model Expansion from the Model Actions menu when you have an open model, or select a model and click Expand on the Modeler landing page.
NO-IO conversion update
NO-IO conversion has been updated to remove dependence on macro actions. This change improves performance and stability.
Configuration tables for solvers
Models now include configuration tables for the Network Optimization, Inventory Optimization and Transportation Optimization solvers: Config_NO, Config_IO, and Config_TO. These tables are used to set optional solver parameters and each is populated with a default set of parameters. To use the parameters when solving, set the Status to "Include" and adjust the Parameter Value as needed. Coupa may provide additional parameters in the future.
Additional Network Optimization output columns
The following columns have been added to Network Optimization output tables:
-
Financial Summary > Tax Cost - The total cost from tax, calculated as: Period End Refundable Tax Balance + Non-Refundable Tax Credit.
-
Product Summary > Intransit Inventory Holding Cost - The cost from units considered as inventory due to their inaccessibility during transportation.
Input Tables
|
Table |
Column |
Description of Change |
Model Database Table Name |
Model Database Column Name |
Data Type |
Required |
|---|---|---|---|---|---|---|
|
Input Tables |
||||||
|
Config_IO |
Parameter Name |
New table/column |
Config_IO |
ParameterName |
Text |
Yes |
|
Parameter Value |
New table/column |
Config_IO |
ParameterValue |
Text |
Yes |
|
|
Status |
New table/column |
Config_IO |
Status |
Text |
No |
|
|
Description |
New table/column |
Config_IO |
Description |
Text |
No |
|
|
Config_NO
|
Parameter Name |
New table/column |
Config_NO |
ParameterName |
Text |
Yes |
|
Parameter Value |
New table/column |
Config_NO |
ParameterValue |
Text |
Yes |
|
|
Status |
New table/column |
Config_NO |
Status |
Text |
No |
|
|
Description |
New table/column |
Config_NO |
Description |
Text |
No |
|
|
Config_TO
|
Parameter Name |
New table/column |
Config_TO |
ParameterName |
Text |
Yes |
|
Parameter Value |
New table/column |
Config_TO |
ParameterValue |
Text |
Yes |
|
|
Status |
New table/column |
Config_TO |
Status |
Text |
No |
|
|
Description |
New table/column |
Config_TO |
Description |
Text |
No |
|
|
Site Storage Spaces |
Name |
New table/column |
SiteStorageSpaces |
SpaceName |
Text |
Yes |
|
Site Name |
New table/column |
SiteStorageSpaces |
SiteName |
Text |
Yes |
|
|
Initial Period |
New table/column |
SiteStorageSpaces |
InitialPeriod |
Text |
No |
|
|
Cube-Floor Ratio |
New table/column |
SiteStorageSpaces |
CubeFloorRatio |
Float |
No |
|
|
Min Floor Space |
New table/column |
SiteStorageSpaces |
MinFloorSpace |
Text |
No |
|
|
Max Floor Space |
New table/column |
SiteStorageSpaces |
MaxFloorSpace |
Text |
No |
|
|
Min Floor Expansion |
New table/column |
SiteStorageSpaces |
MinFloorExpansion |
Text |
No |
|
|
Max Floor Expansion |
New table/column |
SiteStorageSpaces |
MaxFloorExpansion |
Text |
No |
|
|
Floor Expansion Cost |
New table/column |
SiteStorageSpaces |
FloorExpansionCost |
Text |
No |
|
|
Percent Full |
New table/column |
SiteStorageSpaces |
PercentFull |
Float |
No |
|
|
Status |
New table/column |
SiteStorageSpaces |
Status |
Text |
No |
|
|
Site Shipping Spaces |
Name |
New table/column |
SiteShippingSpaces |
SpaceName |
Text |
Yes |
|
Site Name |
New table/column |
SiteShippingSpaces |
SiteName |
Text |
Yes |
|
|
Initial Period |
New table/column |
SiteShippingSpaces |
InitialPeriod |
Text |
No |
|
|
Throughput-Space Ratio |
New table/column |
SiteShippingSpaces |
ThroughputSpaceRatio |
Float |
No |
|
|
Min Floor Space |
New table/column |
SiteShippingSpaces |
MinFloorSpace |
Text |
No |
|
|
Max Floor Space |
New table/column |
SiteShippingSpaces |
MaxFloorSpace |
Text |
No |
|
|
Min Floor Expansion |
New table/column |
SiteShippingSpaces |
MinFloorExpansion |
Text |
No |
|
|
Max Floor Expansion |
New table/column |
SiteShippingSpaces |
MaxFloorExpansion |
Text |
No |
|
|
Floor Expansion Cost |
New table/column |
SiteShippingSpaces |
FloorExpansionCost |
Text |
No |
|
|
Percent Utilized |
New table/column |
SiteShippingSpaces |
PercentUtilized |
Float |
No |
|
|
Status |
New table/column |
SiteShippingSpaces |
Status |
Text |
No |
|
|
Site Other Spaces |
Name |
New table/column |
SiteOtherSpaces |
SpaceName |
Text |
Yes |
|
Site Name |
New table/column |
SiteOtherSpaces |
SiteName |
Text |
Yes |
|
|
Initial Period |
New table/column |
SiteOtherSpaces |
InitialPeriod |
Text |
No |
|
|
Fixed Space |
New table/column |
SiteOtherSpaces |
FixedSpace |
Text |
No |
|
|
Status |
New table/column |
SiteOtherSpaces |
Status |
Text |
No |
|
|
Storage Space Assignments |
Site Name |
New table/column |
StorageSpaceAssignments |
SpaceName |
Text |
Yes |
|
Space |
New table/column |
StorageSpaceAssignments |
SiteName |
Text |
Yes |
|
|
Product |
New table/column |
StorageSpaceAssignments |
ProductName |
Text |
Yes |
|
|
Utilization |
New table/column |
StorageSpaceAssignments |
Utilization |
Float |
No |
|
|
Status |
New table/column |
StorageSpaceAssignments |
Status |
Text |
No |
|
|
Receiving Space Assignments |
Site Name |
New table/column |
ReceivingSpaceAssignments |
SpaceName |
Text |
Yes |
|
Space |
New table/column |
ReceivingSpaceAssignments |
SiteName |
Text |
Yes |
|
|
Product |
New table/column |
ReceivingSpaceAssignments |
ProductName |
Text |
Yes |
|
|
Utilization |
New table/column |
ReceivingSpaceAssignments |
Utilization |
Float |
No |
|
|
Status |
New table/column |
ReceivingSpaceAssignments |
Status |
Text |
No |
|
|
Dispatch Space Assignments
|
Site Name |
New table/column |
DispatchSpaceAssignments |
SpaceName |
Text |
Yes |
|
Space |
New table/column |
DispatchSpaceAssignments |
SiteName |
Text |
Yes |
|
|
Product |
New table/column |
DispatchSpaceAssignments |
ProductName |
Text |
Yes |
|
|
Utilization |
New table/column |
DispatchSpaceAssignments |
Utilization |
Float |
No |
|
|
Status |
New table/column |
DispatchSpaceAssignments |
Status |
Text |
No |
|
|
Sites |
Site Variable Cost |
New column |
Sites |
SiteVariableCost |
Text |
No |
|
Site Variable Cost Basis |
New column |
Sites |
SiteVariableCostBasis |
Text |
No |
|
|
Fixed Operating Space Expansion Cost |
New column |
Sites |
FixedOperatingSpaceExpansionCost |
Text |
No |
|
|
Site Variable CO2 |
New column |
Sites |
SiteVariableCO2 |
Text |
No |
|
|
Site Variable CO2 Basis |
New column |
Sites |
SiteVariableCO2Basis |
Text |
No |
|
|
Fixed CO2 Space Expansion Rate |
New column |
Sites |
FixedCO2SpaceExpansionRate |
Text |
No |
|
|
Initial Floor Space |
New column |
Sites |
InitialFloorSpace |
Text |
No |
|
|
Min Floor Expansion |
New column |
Sites |
MinFloorExpansion |
Text |
No |
|
|
Max Floor Expansion |
New column |
Sites |
MaxFloorExpansion |
Text |
No |
|
|
Sites Multi-Period |
Site Variable Cost |
New column |
Sites_MultiPeriod |
SiteVariableCost |
Text |
No |
|
Site Variable Cost Basis |
New column |
Sites_MultiPeriod |
SiteVariableCostBasis |
Text |
No |
|
|
Fixed Operating Space Expansion Cost |
New column |
Sites_MultiPeriod |
FixedOperatingSpaceExpansionCost |
Text |
No |
|
|
Min Floor Expansion |
New column |
Sites_MultiPeriod |
MinFloorExpansion |
Text |
No |
|
|
Site Variable CO2 |
New column |
Sites_MultiPeriod |
SiteVariableCO2 |
Text |
No |
|
|
Site Variable CO2 Basis |
New column |
Sites_MultiPeriod |
SiteVariableCO2Basis |
Text |
No |
|
|
Fixed CO2 |
New column |
Sites_MultiPeriod |
FixedCO2 |
|
|
|
|
Fixed CO2 Space Expansion Rate |
New column |
Sites_MultiPeriod |
FixedCO2SpaceExpansionRate |
Text |
No |
|
|
Inventory Policies |
Unhealthy Turn Percent |
New column |
InventoryPolicies |
UnhealthyTurnPercent |
Float |
No |
|
Fixed Excess Stock |
New column |
InventoryPolicies |
FixedExcessStock |
Text |
No |
|
|
Excess Move Percent |
New column |
InventoryPolicies |
ExcessMovePercent |
Float |
No |
|
|
Inventory Policies Multi-Period |
Unhealthy Turn Percent |
New column |
InventoryPolicies_MultiPeriod |
UnhealthyTurnPercent |
|
|
Output Tables
|
Table |
Column |
Description of Change |
Model Database Table Name |
Model Database Column Name |
Data Type |
|---|---|---|---|---|---|
|
Output Tables |
|||||
|
Network Summary |
Space Expansion Cost |
New column |
OptimizationOutputNetworkSummary |
SpaceExpansionCost |
Money |
|
Site Variable Cost |
New column |
OptimizationOutputNetworkSummary |
SiteVariableCost |
Money |
|
|
Financial Summary |
Space Expansion Cost |
New column |
OptimizationOutputFinancialSummary |
SpaceExpansionCost |
Money |
|
Site Variable Cost |
New column |
OptimizationOutputFinancialSummary |
SiteVariableCost |
Money |
|
|
Tax Cost |
New column |
OptimizationOutputFinancialSummary |
TotalTaxCost |
Money |
|
|
Network Organization Summary |
Space Expansion Cost |
New column |
OptimizationOutputOrganizationSummary |
SpaceExpansionCost |
Money |
|
Site Variable Cost |
New column |
OptimizationOutputOrganizationSummary |
SiteVariableCost |
Money |
|
|
Network Site Summary |
Space Expansion Cost |
New column |
OptimizationOutputCustomerFlows |
SpaceExpansionCost |
Money |
|
Site Variable Cost |
New column |
OptimizationOutputCustomerFlows |
SiteVariableCost |
Money |
|
|
Site Variable CO2 |
New column |
OptimizationOutputCustomerFlows |
SiteVariableCO2 |
Float |
|
|
Network Product Summary |
Site Variable Cost |
New column |
OptimizationOutputProductSummary |
SiteVariableCost |
Money |
|
Site Variable CO2 |
New column |
OptimizationOutputProductSummary |
SiteVariableCO2 |
Float |
|
|
Intransit Inventory Holding Cost |
New column |
OptimizationOutputProductSummary |
IntransitInventoryHoldingCost |
Money |
|
|
Network Inventory Summary |
Excess Inventory |
New column |
OptimizationOutputInventory |
ExcessInventory |
Float |
|
Site Space Summary
|
Site |
New table/column |
OptimizationOutputSiteSpaceSummary |
SiteName |
Text |
|
Product |
New table/column |
OptimizationOutputSiteSpaceSummary |
PeriodName |
Text |
|
|
Initial Size |
New table/column |
OptimizationOutputSiteSpaceSummary |
InitialSize |
Float |
|
|
Total Floor Space |
New table/column |
OptimizationOutputSiteSpaceSummary |
TotalFloorSpace |
Float |
|
|
Expansion Size |
New table/column |
OptimizationOutputSiteSpaceSummary |
ExpansionSize |
Float |
|
|
Used Floor Space |
New table/column |
OptimizationOutputSiteSpaceSummary |
UsedFloorSpace |
Float |
|
|
Unused Floor Space |
New table/column |
OptimizationOutputSiteSpaceSummary |
UnusedFloorSpace |
Float |
|
|
Space Utilization |
New table/column |
OptimizationOutputSiteSpaceSummary |
SpaceUtilization |
Float |
|
|
Total Throughput |
New table/column |
OptimizationOutputSiteSpaceSummary |
TotalThroughput |
Float |
|
|
Total Fixed Operating Cost |
New table/column |
OptimizationOutputSiteSpaceSummary |
TotalFixedOperatingCost |
Money |
|
|
Total Fixed Operating CO2 |
New table/column |
OptimizationOutputSiteSpaceSummary |
TotalFixedOperatingCO2 |
Float |
|
|
Added Operating Cost |
New table/column |
OptimizationOutputSiteSpaceSummary |
AddedOperatingCost |
Money |
|
|
Added Operating CO2 |
New table/column |
OptimizationOutputSiteSpaceSummary |
AddedOperatingCO2 |
Float |
|
|
Site Variable Cost |
New table/column |
OptimizationOutputSiteSpaceSummary |
SiteVariableCost |
Money |
|
|
Site Variable CO2 |
New table/column |
OptimizationOutputSiteSpaceSummary |
SiteVariableCO2 |
Float |
|
|
Scenario ID |
New table/column |
OptimizationOutputSiteSpaceSummary |
ScenarioID |
Int |
|
|
Sub-Scenario ID |
New table/column |
OptimizationOutputSiteSpaceSummary |
StepNumber |
Int |
|
|
Storage Space Summary
|
Site |
New table/column |
OptimizationOutputStorageSpaceSummary |
SiteName |
Text |
|
Space |
New table/column |
OptimizationOutputStorageSpaceSummary |
SpaceName |
Text |
|
|
Period |
New table/column |
OptimizationOutputStorageSpaceSummary |
PeriodName |
Text |
|
|
Initial Period |
New table/column |
OptimizationOutputStorageSpaceSummary |
InitialPeriod |
Text |
|
|
Starting Size |
New table/column |
OptimizationOutputStorageSpaceSummary |
StartingSize |
Float |
|
|
Minimum Size |
New table/column |
OptimizationOutputStorageSpaceSummary |
MinimumSize |
Float |
|
|
Total Floor Space |
New table/column |
OptimizationOutputStorageSpaceSummary |
TotalFloorSpace |
Float |
|
|
Expansion Size |
New table/column |
OptimizationOutputStorageSpaceSummary |
ExpansionSize |
Float |
|
|
Expansion Cost |
New table/column |
OptimizationOutputStorageSpaceSummary |
ExpansionCost |
Money |
|
|
Total Throughput |
New table/column |
OptimizationOutputStorageSpaceSummary |
TotalThroughput |
Float |
|
|
Total Storage Space |
New table/column |
OptimizationOutputStorageSpaceSummary |
TotalStorageSpace |
Float |
|
|
Used Floor Space |
New table/column |
OptimizationOutputStorageSpaceSummary |
UsedFloorSpace |
Float |
|
|
Unused Floor Space |
New table/column |
OptimizationOutputStorageSpaceSummary |
UnusedFloorSpace |
Float |
|
|
Space Utilization |
New table/column |
OptimizationOutputStorageSpaceSummary |
SpaceUtilization |
Float |
|
|
Scenario ID |
New table/column |
OptimizationOutputStorageSpaceSummary |
ScenarioID |
Int |
|
|
Sub-Scenario ID |
New table/column |
OptimizationOutputStorageSpaceSummary |
Sub-ScenarioID |
Int |
|
|
Shipping Space Summary |
Site |
New table/column |
OptimizationOutputShippingSpaceSummary |
SiteName |
Text |
|
Space |
New table/column |
OptimizationOutputShippingSpaceSummary |
SpaceName |
Text |
|
|
Period |
New table/column |
OptimizationOutputShippingSpaceSummary |
PeriodName |
Text |
|
|
Initial Period |
New table/column |
OptimizationOutputShippingSpaceSummary |
InitialPeriod |
Text |
|
|
Starting Size |
New table/column |
OptimizationOutputShippingSpaceSummary |
StartingSize |
Float |
|
|
Minimum Size |
New table/column |
OptimizationOutputShippingSpaceSummary |
MinimumSize |
Float |
|
|
Total Floor Space |
New table/column |
OptimizationOutputShippingSpaceSummary |
TotalFloorSpace |
Float |
|
|
Expansion Size |
New table/column |
OptimizationOutputShippingSpaceSummary |
ExpansionSize |
Float |
|
|
Expansion Cost |
New table/column |
OptimizationOutputShippingSpaceSummary |
ExpansionCost |
Money |
|
|
Total Throughput Receiving |
New table/column |
OptimizationOutputShippingSpaceSummary |
TotalThroughputReceiving |
Float |
|
|
Total Throughput Dispatch |
New table/column |
OptimizationOutputShippingSpaceSummary |
TotalThroughputDispatch |
Float |
|
|
Receiving Floor Space |
New table/column |
OptimizationOutputShippingSpaceSummary |
ReceivingFloorSpace |
Float |
|
|
Dispatch Floor Space |
New table/column |
OptimizationOutputShippingSpaceSummary |
DispatchFloorSpace |
Float |
|
|
Used Floor Space |
New table/column |
OptimizationOutputShippingSpaceSummary |
UsedFloorSpace |
Float |
|
|
Unused Floor Space |
New table/column |
OptimizationOutputShippingSpaceSummary |
UnusedFloorSpace |
Float |
|
|
Space Utilization |
New table/column |
OptimizationOutputShippingSpaceSummary |
SpaceUtilization |
Float |
|
|
Scenario ID |
New table/column |
OptimizationOutputShippingSpaceSummary |
ScenarioID |
Int |
|
|
Sub-Scenario ID |
New table/column |
OptimizationOutputShippingSpaceSummary |
StepNumber |
Int |
|
|
Other Space Summary |
Site |
New table/column |
OptimizationOutputOtherSpaceSummary |
SiteName |
Text |
|
Space |
New table/column |
OptimizationOutputOtherSpaceSummary |
SpaceName |
Text |
|
|
Period |
New table/column |
OptimizationOutputOtherSpaceSummary |
PeriodName |
Text |
|
|
Initial Period |
New table/column |
OptimizationOutputOtherSpaceSummary |
InitialPeriod |
Text |
|
|
Total Floor Space |
New table/column |
OptimizationOutputOtherSpaceSummary |
TotalFloorSpace |
Float |
|
|
Scenario ID |
New table/column |
OptimizationOutputOtherSpaceSummary |
ScenarioID |
Int |
|
|
Sub-Scenario ID |
New table/column |
OptimizationOutputOtherSpaceSummary |
StepNumber |
Int |
|
|
Storage Space Details |
Site |
New table/column |
OptimizationOutputStorageSpaceDetails |
SiteName |
Text |
|
Space |
New table/column |
OptimizationOutputStorageSpaceDetails |
SpaceName |
Text |
|
|
Product |
New table/column |
OptimizationOutputStorageSpaceDetails |
ProductName |
Text |
|
|
Period |
New table/column |
OptimizationOutputStorageSpaceDetails |
PeriodName |
Text |
|
|
Total Throughput |
New table/column |
OptimizationOutputStorageSpaceDetails |
TotalThroughput |
Float |
|
|
Total Floor Space |
New table/column |
OptimizationOutputStorageSpaceDetails |
TotalFloorSpace |
Float |
|
|
Total Storage Space |
New table/column |
OptimizationOutputStorageSpaceDetails |
TotalStorageSpace |
Float |
|
|
Cycle Stock |
New table/column |
OptimizationOutputStorageSpaceDetails |
CycleStock |
Float |
|
|
Prebuild Stock |
New table/column |
OptimizationOutputStorageSpaceDetails |
PrebuildStock |
Float |
|
|
Safety Stock |
New table/column |
OptimizationOutputStorageSpaceDetails |
SafetyStock |
Float |
|
|
Turn Based Stock |
New table/column |
OptimizationOutputStorageSpaceDetails |
TurnBasedStock |
Float |
|
|
Excess Stock |
New table/column |
OptimizationOutputStorageSpaceDetails |
ExcessStock |
Float |
|
|
Total Inventory |
New table/column |
OptimizationOutputStorageSpaceDetails |
TotalInventory |
Float |
|
|
Scenario ID |
New table/column |
OptimizationOutputStorageSpaceDetails |
ScenarioID |
Int |
|
|
Sub-Scenario ID |
New table/column |
OptimizationOutputStorageSpaceDetails |
StepNumber |
Int |
|
|
Receiving Space Details |
Site |
New table/column |
OptimizationOutputReceivingSpaceDetails |
SiteName |
Text |
|
Space |
New table/column |
OptimizationOutputReceivingSpaceDetails |
SpaceName |
Text |
|
|
Product |
New table/column |
OptimizationOutputReceivingSpaceDetails |
ProductName |
Text |
|
|
Period |
New table/column |
OptimizationOutputReceivingSpaceDetails |
PeriodName |
Text |
|
|
Total Throughput |
New table/column |
OptimizationOutputReceivingSpaceDetails |
TotalThroughput |
Float |
|
|
Total Floor Space |
New table/column |
OptimizationOutputReceivingSpaceDetails |
TotalFloorSpace |
Float |
|
|
Scenario ID |
New table/column |
OptimizationOutputReceivingSpaceDetails |
ScenarioID |
Int |
|
|
Sub-Scenario ID |
New table/column |
OptimizationOutputReceivingSpaceDetails |
StepNumber |
Int |
|
|
Dispatch Space Details |
Site |
New table/column |
OptimizationOutputDispatchSpaceDetails |
SiteName |
Text |
|
Space |
New table/column |
OptimizationOutputDispatchSpaceDetails |
SpaceName |
Text |
|
|
Product |
New table/column |
OptimizationOutputDispatchSpaceDetails |
ProductName |
Text |
|
|
Period |
New table/column |
OptimizationOutputDispatchSpaceDetails |
PeriodName |
Text |
|
|
Total Throughput |
New table/column |
OptimizationOutputDispatchSpaceDetails |
TotalThroughput |
Float |
|
|
Total Floor Space |
New table/column |
OptimizationOutputDispatchSpaceDetails |
TotalFloorSpace |
Float |
|
|
Scenario ID |
New table/column |
OptimizationOutputDispatchSpaceDetails |
ScenarioID |
Int |
|
|
Sub-Scenario ID |
New table/column |
OptimizationOutputDispatchSpaceDetails |
StepNumber |
Int |
|
Home page features
Model Building
Transaction table and policy table filters
You can now define filters on transaction tables (such as Orders Full, Demand Forecast, Inventory Transactions) and policy tables (such as Production Policies, Sourcing Policies, and Shipment Lanes). For example, you can use these filters to limit which costs are included in the model tables based on the source you select for costs. These filters are applied in addition to filters you may have defined on the Core Elements in your model recipe.
Inventory cost definition
For inventory policies, you can now define the inbound and outbound handling costs based on data in specific Decision Data Model tables. You can also define the inventory carrying cost, either based on data in the Inventory Policies DDM table or by manually entering the value.
Weighted average calculations
The Numerical Field Aggregation in Aggregation Rules offers weighted average as an aggregation operator. For example, you can select "AVG (Weighted by Orders Full)" to calculate aggregated latitude and longitude values based on the order volume at customer locations.
Customer Demand source
The Notes column in Customer Demand model records now reflects whether the record source was historic DDM data (Orders Full, Shipments Full) or forecast data (Demand Forecast).
Additional mappings to model tables
A number of additional mappings have been defined to populate data from DDM tables to tables in the model. Source Lead Time and Minimum Order Quantity are mapped from columns in sourcing_policies to the Customer Sourcing Policies and Site Sourcing Policies tables. Values such as Source Lead Time, Minimum Order Quantity, Inventory Turns, Safety Stock, and Service Requirement are mapped from columns in inventory_policies to the Inventory Policies table. Fixed Shipment Cost is mapped from transportation_mode to the Modes table. The product_type in product_dimension is mapped to the Notes column in the Products table.
Additional aggregation fields
The location_classification field is now available as an aggregation field for Customers and Sites. The product_type field is available as an aggregation field for Products.
Data Management
Upload Data for Decision Data Models
Data Management now includes the ability to upload CSV files to DDMs in the Data Viewer.
Database Extension for Decision Data Models
Decision Data Models can now be expanded to include additional tables and columns. Adding columns to existing tables allows you to customize your DDM to include additional metadata which is not already available in the DDM structure. Adding tables to your DDM provides additional content for use within the SCDP platform (for example, adding lookup tables for macros). Extension columns are supported across the platform.
Preview During Dynamic View Creation
A new Preview tab will be added to the Dynamic View editor to enable you to quickly see the results of your dynamic views. This will help you validate that you have set up a view correctly. Previously, you had to create an App Studio app board for every view you wanted to preview, which required access to App Studio.
Duplicating Dynamic Views
You will now be able to duplicate an existing dynamic view. You can then use this duplicated view as a starting point for a new view.
Macros
Unique icons added for each Macros action
The following macro actions will now have unique icons to help identify them on the Macros workspace:
-
Insert
-
Update
-
Delete
-
Scalar Query
-
Excel Export
-
Excel Import
-
DA Model
New RowNumber function added to Statement Editor
A new window function called RowNumber will be added to the Statement Editor. This function returns the sequential number of a row within a partition of a result set, starting at 1 for the first row in each partition. It can be used with all data types.
RowNumber will work similarly to the Rank and DenseRank functions. It must be used with the OrderBy function and optionally can use the PartitionBy function.
New ToDateTime() conversion function
The ToDateTime() function has been added to the Statement Editor. This function converts the value to its left to a date. It is available for Float, Integer, and String data types.
Culture parameter added to conversion functions
All conversion functions will now include a Culture parameter. This change has been made to the conversion functions provided in the Statement Editor:
-
ToString()
-
ToFloat()
-
ToInteger()
-
ToDateTime()
The Culture parameter allows you to specify the formatting used to display the data according to the locale of the users (for example, whether decimal values use a comma or a period). Valid values for the Culture parameter are pulled from .NET’s list of available culture codes. When you edit the function using the Statement Editor interface, a number of commonly used values will display when you click in the Culture field. You can select a value or type the value you need. You can also add the Culture value using the Statement Text Editor.
To ensure backwards compatibility, if no Culture is specified then the function will use the current locale, which either comes from the user’s browser or the (also optional) locale in the LLAPI call that started the macro. In addition, the conversion is performed using the CAST() function. This is the pre-existing functionality.
Formatting with the ToString() function
The ToString() function has been enhanced to include a Formatting parameter. This parameter allows the user to specify the formatting of the resulting string.
In the ToString() function, the interaction of the Formatting and Culture parameters is as follows:
-
If you omit both parameters, a default conversion to a string using the CAST() function is used. This is the existing functionality and is done for backwards compatibility.
-
If only Format is specified, then it is used and Culture defaults to the culture from the browser or LLAPI Culture value. Note that this is a .NET format string.
-
If only Culture is specified, the format defaults based on the data type. For float types, we recommend F2 or similar.
-
If both Format and Culture are specified, they are both used.
Improved entry of function parameters in Statement Editor
When a parameter in the Statement Editor is a simple string constant and not a longer expression, the Statement Editor will now provide a toggle to switch between entering the parameter value in a text field, or selecting from a dropdown list.
Function reference help improved
The Statement Editor function reference in the help has been expanded and improved. This includes more use cases and more information about using functions together.
Supply Chain API
New endpoints
- GET /odata/v1/ddm/{ddmId}/{tableName}({key})
Returns information for the DDM with the specified ID.
For more information on using the Supply Chain API, see the Supply Chain API Portal at https://developer.llama.ai.
App Studio
Conditional formatting with hidden columns
Conditional formatting in App Studio now allows you to create rules based on hidden columns or use a hidden column as a dynamic condition to apply formatting to another column.
Demand Modeler
Trend Cloud Options moving to Trend Cloud Selections tab
The Trend Cloud task options were originally configured on the Scenario page's Parameters tab. To make these options easier to use, they will now be located under the Options button on the Inputs page's Trend Cloud Selection tab. A pop-up screen to configure the above options will appear.
SCDP 33.4.0 The new Demand Modeler application is a web-based app that provides demand forecasting in the cloud using a powerful AI forecasting engine. It provides accurate mid- to long- term forecasts using demand history, internal causal information (price, promotions, etc.), and external time series data available through Coupa's Trend Cloud (such as macroeconomic and World Bank time series data).
Typical users include demand modelers and supply chain modelers interested in forecasting demand.

With Demand Modeler, you can:
- Predict SKU, product family, and location/market level demand for mid- to long-term planning horizons of 12 months to 5 years in weekly, monthly, or quarterly time periods.
- Improve forecast accuracy and quantify key demand drivers.
- Use powerful AI capabilities for self-learning complex features while also adjusting for seasonal trend patterns and lags that are critical for long term forecasting.
- Develop global models for cross-learning across multiple time series and identifying patterns that are often difficult to model based on a single time series.
- Incorporate internal data such as ad spend and price changes.
- Consider external data such macro-economic indicators.
- Automate the forecast generation process for all products under one framework by combining tournament and ensemble modeling approaches with optimization of model parameters and hyper-parameters.
- Measure and monitor forecast errors to identify products or locations that require further management.
Modeler
SCDP 34.3.0 Geocoding improvements
When using Bing geocoding, the Geocode button is now disabled while the geocoding task is running. Once the task is complete, the Geocode button is enabled and the table is refreshed to display the updated Latitude and Longitude values.
Enhanced supply chain design-to-source workflow
The integrated workflow between Modeler and Coupa Sourcing Optimization (CSO) now supports shipment size and per truckload cost as part of the sourcing request. The Per Truckload Cost is the (Total Flow Transportation Cost / Total Flow Units) * Shipment Size. This cost depends on the units of measure (EA, KG, CFT, etc.).
Once Modeler has received a CSO event, the CSO data can be loaded automatically into the Transportation Policies table using the Populate feature on the Sourcing Event tab.
In addition, there are pre-defined product filters for each combination of the Temperature Class and Hazardous Goods values. These filters are supported wherever Product is used in input tables. They are use to generate product sets for use in Network Optimization.
Product filters for temperature class and hazardous goods
Pre-defined product filters have been added that you can use to select products based on their Temperature Class and Hazardous Goods values. For example, you now see filters such as the following in any dropdown where you select Products:
-
(ALL_Frozen-NonHazardous_Products)
-
(ALL_Heated_Products)
These filters are particularly useful if you are using the integration to Coupa Sourcing Optimization (CSO).
Product and shipment characteristics in output tables
New columns have been added to the Customer Flows, InterSite Flows and Return Flows output tables to reflect the product and shipment characteristics used with the CSO integration:
-
Temperature Class
-
Hazardous Goods
-
Average Shipment Size
-
Shipment Size Basis
Policy Parameter default values
The default value for the Policy Parameter column has been changed from 1 to null in the following tables:
-
Customer Sourcing Policies
-
Customer Sourcing Policies Multi-Period
-
Site Sourcing Policies
-
Site Sourcing Policies Multi-Period
-
Transportation Policies
This change is to prevent Policy Parameter values from being interpreted as 1% for SplitByRatio and Probability policies. It will not affect the Policy Parameter values in existing records.
Backhaul matching in Transportation Optimization
Backhaul Matching is a specialized case of Interleaved Optimization. It is designed for problems with multiple full-truckload (FTL) shipments, whereby the goal is to optimally match the outbound/linehaul FTL shipments with the inbound/backhaul ones. As a result, the routes in backhaul matching can have at most 2 shipments.
Duplicate options not permitted in Options table
You can no longer enter multiple records in the Options model database table with the same Option value. Duplicate options can result in serious issues, such as failure to open the model or preventing access to the Options in the Launch Pad. Updating the Options table using tools such as SQL Server Management Studio, Data Guru and App Studio no longer allows the creation of a duplicate option record. These records are flagged as duplicates.
Total Tax Cost in the Financial Summary output table
The Total Tax Cost has been added to the Total Cost in the Financial Summary output table.
New Greenfield Analysis solver
The default Greenfield Analysis solver is a new C# solver. The solver has been updated to achieve uniformity in the solver language.
Cross-period cost to serve support
Cost to serve analysis in Network Optimization now supports cross-period path definitions for transportation, production, and inventory. This is useful in cases where, for example, the transport or production time exceeds the length of a period. Cost to serve performs decomposition on products and periods, then uses dummy nodes to handle the cross-period production, inventory, and transportation. It uses a path search to find all cross-period flows, then assembles cross period paths. In many models, this new method results in a larger number of paths and may also generate paths with longer distances and times.
Bing geocoding
The default geocoding provider is now Bing. As in previous releases, you launch geocoding using the Geocode function in the Customers and Sites input tables. Geocoding is executed through a task that is displayed on the Tasks tab of Queue Management. You can review the task log for information about the status of geocoding.
Map basemaps
The basemap provider for Maps is now Bing. The default Map Type is "Bing Road". "Bing Aerial" is available as an alternate Map Type.
Column display in Modeler tables
Control for column display in Modeler input and output tables has been improved:
-
Multi-select columns to hide or display - Right-click on a column header, then uncheck/check one or more columns you want to hide or display.
-
Drag and drop to control column order - Right-click on a column header, then drag and drop columns to determine the order in which they are displayed in the table.
Support for SQL Server 2019
The default SQL Server version for models and databases created on llama.ai is now SQL Server 2019. Models and databases in SQL Server 2016 and SQL Server 2017 are also supported when uploaded to llama.ai. When you download a model or database, it maintains its original SQL Server version.
Platform support for model versions
The Supply Chain platform supports models with a database schema of up to 1 year old. As of release 34.0.0, this includes models from releases back to the 2020.12 release (schema version 303001). Models with unsupported schemas must be upgraded prior to solving, modeling, using with apps or solving on the cloud. Support is ending for the following schema version:
-
302000
Supply Chain Homepage
Model Building
Manually entered transportation costs
When defining basic transportation costs for Customer Lanes and Site Lanes, you now have the option to manually enter values for fixed cost, variable cost and basis, and shipment size and basis. The values you enter are applied to all Transportation Policies generated for the Customer and/or Site Lanes.
Default transportation costs
If you are using Shipment Headers, Shipment Lanes, or the Shipment Cost Matrix for basic transportation costs, you can define default costs to be applied if there is no cost data available for the selected source. These user-entered costs act as a back-up: the selected cost calculation method is used, such as deriving costs from Shipment Headers. For any of the resulting transportation policies where there is no cost data due to lack of available data, the default user-entered cost is used.
Opt-in for production costs
The default setting for Production Costs when creating a recipe is now "No Production Costs". Use the "Select the source for your Production Costs" option to access the list of tables from which you can populate the costs in your Production Policies table.
Data Management
Support for SQL Server 2019
The default version for models and databases created with Data Management is now SQL Server 2019.
Supply Chain API
New endpoints
- POST /v4/import/session
Creates a session using the specified ID.
- GET /v4/import/session/{sessionId}
Returns information for the session with the specified ID.
- PUT /v4/import/session/{sessionId}/close
Closes the session with the specified session ID.
- GET /v4/import/session/{sessionId}/error
Returns errors for the session with the specified ID.
- GET /v4/import/session/{sessionId}/status
Returns the status of the session with the specified ID.
- PUT /v4/import/session/{sessionId}/table/{tableName}/record
Inserts or updates data in the specified asset table.
- GET /v4/model/{modelId}/groups
Returns a list containing the groups in the specified model.
- POST /v4/model/{modelId}/groups
Creates a group in the specified model.
- PATCH /v4/model/{modelId}/groups/{groupId}
Updates a group in the specified model.
- DELETE /v4/model/{modelId}/groups/{groupId}
Deletes a group in the specified model.
- POST /v4/model/{modelId}/groups/{groupId}/copy
Copies a group in the specified model.
- GET /v4/model/{modelId}/groups/availableMembers/{tableName}
Returns a list containing the available group members for a specified table.
- GET /v4/model/{modelId}/groups/groupTables
Returns a list containing the tables that support groups in a specified model.
- GET /v4/model/{modelId}/modelOptions
Returns a list containing the model options in a specified model.
- PATCH /v4/model/{modelId}/modelOptions
Updates model options in a specified model.
- GET /v4/operation/dataset/{operationId}
Returns the status of a dataset operation.
- GET /v4/operation/record/{operationId}
Returns the status of a record upsert or delete operation.
For more information on using the Supply Chain API, see the Supply Chain API Portal at https://developer.llama.ai.
App Studio
SCDP 33.4.0 Recipe Views
Recipe Views are now available for use in macros and dynamic views.
New If Then Else Function
The If function provides the ability to use conditional logic within the columns of a macro action. This is crucial for product categorization, classification, and policy generation within the model build process. This will allow you to use a single macro action with multiple conditions, rather than multiple macro actions, each with their own conditions.
This function will be available wherever the Statement Editor is available, including in app boards and dynamic views.
The following example is used to drive the policies assigned to products. Classifications might happen on many dimensions such as cost, order volume, order frequency, ordering pattern etc.
IF (Pareto.Score > 0.8, ‘A', IF (Pareto.Score > 0.6, ‘B', IF (Pareto.Score > 0.4, 'C', IF (Pareto.Score > 0.2, 'E’, 'U’))))
New Partition By Function
The Partitioned By function is used for model building. This function allows you to use ‘partition by’ and ‘order by’ logic within the columns of the Insert and Update macro actions. It is used with aggregate functions such as Sum and Count. You can partition by multiple columns and expressions using the Statement Editor.
Use Cases
The use cases for this function include:
- Calculating and ranking top production locations by volume or top sources for each product
- Intermediary calculations in model building
Previously, this functionality required the use of Coupa’s Supply Chain Data Guru product.
This function will be available wherever the Statement Editor is used, including in app boards and dynamic views.
The syntax of the function is:
<table>.<field>.<function>.PartitionBy(<table>.<field>)
The following example partitions orders by location and sums them by location:
Orders.quantity.Sum().PartitionBy(Orders.location)
This would give the following result from a sample Orders table:
| product | location | quantity | result |
| a | 1 | 1 | 3 |
| b | 1 | 2 | 3 |
| c | 2 | 3 | 7 |
| d | 2 | 4 | 7 |
| e | 3 | 5 | 11 |
| f | 3 | 6 | 11 |
The Partition By function can be used with the Order By function to partition, accumulate, and order results by a field. The following example partitions and accumulates orders by location, and orders them by quantity:
Orders.quantity.Sum().PartitionBy(Orders.location).OrderBy(Orders.quantity)
This would give the following result from a sample Orders table:
| product | location | quantity | result |
| a | 1 | 1 | 1 |
| b | 1 | 2 | 3 |
| c | 2 | 3 | 3 |
| d | 2 | 4 | 7 |
| e | 3 | 5 | 5 |
| f | 3 | 6 | 11 |
The Order By function can be used without the Partition By function to order results without partitioning. The following example accumulates orders by quanity, and orders them by quantity in descending order:
Orders.quantity.Sum().OrderBy(Orders.quantity DESC)
This would give the following result from a sample Orders table:
| product | location | quantity | result |
| f | 3 | 6 | 6 |
| e | 3 | 5 | 11 |
| d | 2 | 4 | 15 |
| c | 2 | 3 | 18 |
| b | 1 | 2 | 20 |
| a | 1 | 1 | 21 |
Additional functions being added to support the Partitioned Value functions are:
-
CumulativeSum: this requires the OrderBy() function while PartitionBy() is optional
-
Rank: this requires the OrderBy() function while PartitionBy() is optional
-
DenseRank: this requires the OrderBy() function while PartitionBy() is optional
The default sort order for the new functions is ascending. You can change this sort order to descending by suffixing the statement with 'desc'.
New Weighted Average Function
The Weighted Average function is used for model building. This function allows you to use weighted average logic within the columns of the Insert macro action.
Use Cases
The use cases for this function include deriving an average production or transportation cost from historic transactions weighted by different numeric attributes (production quantity, sales volume, etc.). The weighted average function applies the following weighted average calculation:
-
sum(table.column * weighting_table.column) / Sum(weighting_table.column )
The syntax for Weighted Average is:
<table>.<field>.AverageWeightedBy(<table>.<column>)
For example, "orders.quantity.AverageWeightedBy(orders.cost)" would produce an average quantity weighted by cost.
If the Orders data was:
| product | quantity | cost |
| 1 | 1 | 3 |
| 1 | 2 | 4 |
| 1 | 3 | 5 |
| 2 | 4 | 6 |
| 2 | 5 | 7 |
| 2 | 6 | 8 |
| 3 | 7 | 9 |
| 3 | 8 | 10 |
| 3 | 9 | 11 |
| 3 | 8 | 0 |
The results from the Weighted Average function would be:
| product | average quantity weighted by cost |
average with no weighing for comparison |
| 1 | 2.166667 | 2 |
| 2 | 5.095238 | 5 |
| 3 | 8.066667 | 8 |
In this example, the Weighted Average function is being used to weigh by Quantity:
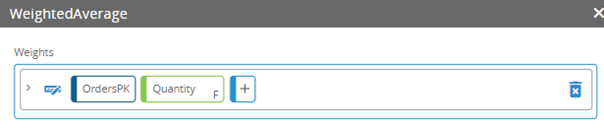
This function will be available wherever the Statement Editor is available, including in app boards and dynamic views.
Visual Joins in Macros
This new capability allows you to visually define joins as a property of macro actions. You will no longer be required to build manual joins before creating macro actions.
Visual Joins Examples
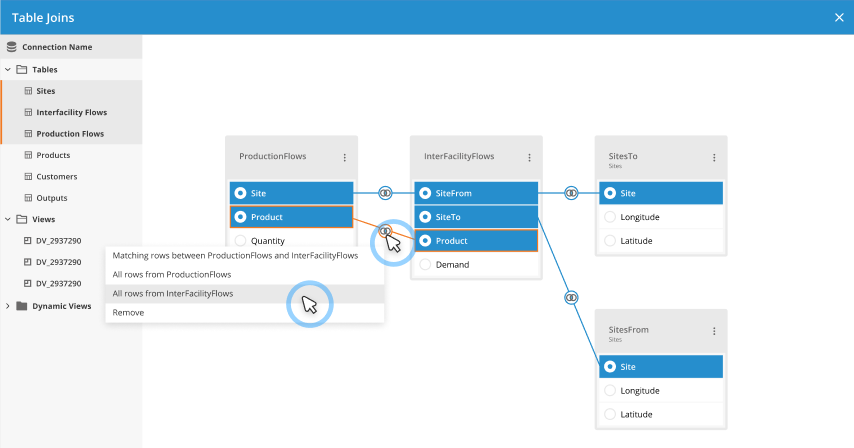
This capability is available in the Insert, Update, Delete, Scalar Query, and Bulk Parameter Update actions.
Using visual joins you can:
- Add and remove joins
- Change a join's type
- Create aliased tables for use with the joins
When you create joins for an action this way, the Statement Editor is filtered to only use the aliased tables referenced in the joins you created. You will no longer need to create <table1>.<table2> references in the Statement Editor to make the joins work. Just pick the tables and columns you need and they will be joined.
Using Statements to Pass Parameters to Functions
The Statement Editor has been updated. It will now allow you to use a statement to specify the value of a parameter, rather than just a text or numerical value.
Statement Editor Examples
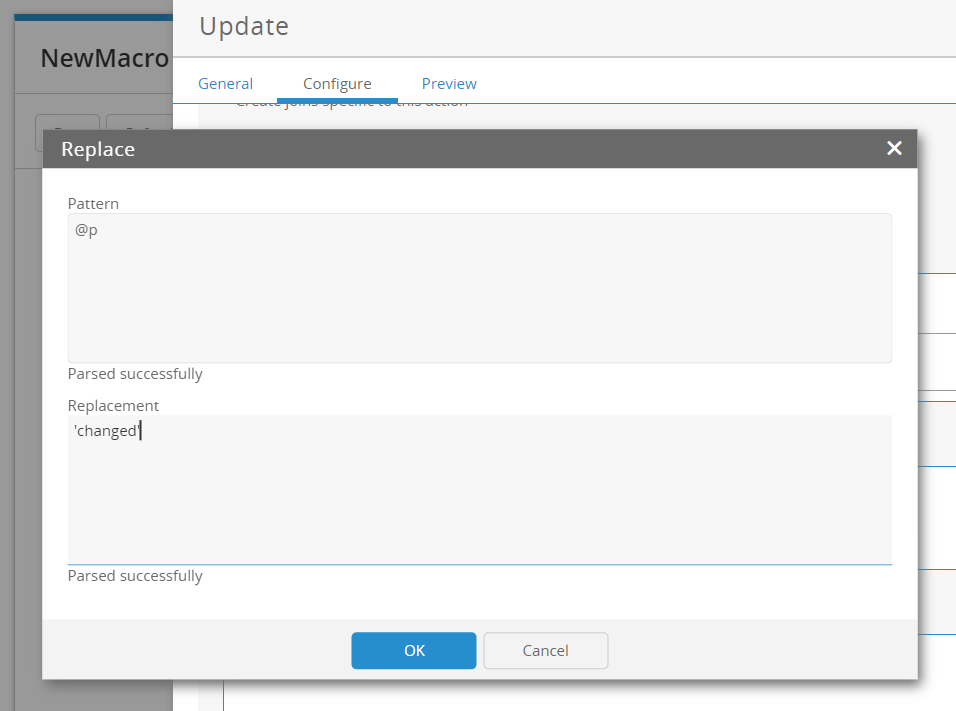
You can also now edit the parameters passed to a function without re-selecting the function in the Statement Editor.
This change will not impact parameters such as datepart and daterollup that currently allow you to select a value from a list.
In the following examples, the existing parameters have been specified by statements:
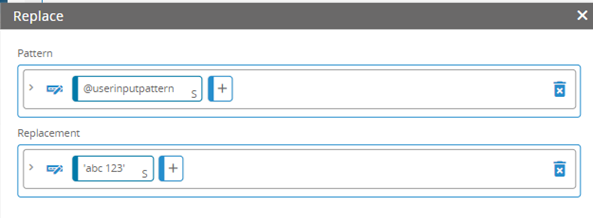
In this example, the updated Statement Editor has been used to specify the three parameters for this If function:
In this example, the updated Statement Editor has been used to specify the parameters for this Partition By function:
In this example, the updated Statement Editor has been used to specify the parameters for this Order By function. Note the ability to sort using the sort icon on the parameter lines:
Latest version of the DDM assets will be used
When selecting a Decision Data Model (DDM) connection in a macro or an app, the latest version of the DDM connection will be used.
Whenever executions are triggered by the following processes, the executions will use the latest version of the DDM asset selected as the connection:
- App
- Macro
- Manual joins
- Dynamic views
Demand Modeler
SCDP 33.4.0 The new Demand Modeler application is a web-based app that provides demand forecasting in the cloud using a powerful AI forecasting engine. It provides accurate mid- to long- term forecasts using demand history, internal causal information (price, promotions, etc.), and external time series data available through Coupa's Trend Cloud (such as macroeconomic and World Bank time series data).
Typical users include demand modelers and supply chain modelers interested in forecasting demand.
With Demand Modeler, you can:
- Predict SKU, product family, and location/market level demand for mid- to long-term planning horizons of 12 months to 5 years in weekly, monthly, or quarterly time periods.
- Improve forecast accuracy and quantify key demand drivers.
- Use powerful AI capabilities for self-learning complex features while also adjusting for seasonal trend patterns and lags that are critical for long term forecasting.
- Develop global models for cross-learning across multiple time series and identifying patterns that are often difficult to model based on a single time series.
- Incorporate internal data such as ad spend and price changes.
- Consider external data such macro-economic indicators.
- Automate the forecast generation process for all products under one framework by combining tournament and ensemble modeling approaches with optimization of model parameters and hyper-parameters.
- Measure and monitor forecast errors to identify products or locations that require further management.
Modeler
Composite risk score
For the supplier nodes in your supply chain model, you can augment the supply chain information with risk scores from Coupa Risk and Performance Management (RPM). This feature enables you to perform a more complete risk assessment of suppliers by considering a number of metrics including financial score, judicial score and news sentiment. The RPM scores can be populated in your Decision Data Model (DDM). From there, this data can be pulled into your model for use in Network Optimization. You can also enter risk profile information directly in the model.
You can apply a relative weight to each score, and an overall node criticality weight which is applied to the actual solution flow when calculating the composite risk scores. For example, supplier financial risk may be more significant to you than other risk factors. In this case, you apply a higher weight to the financial score than to other scores to represent this condition.
You associate risk profiles with suppliers in the Sites table. Using scenarios, you can exclude or constrain the activity for high risk suppliers to assess the impact on your network. You can also analyze the effects of various weighting approaches. This feature allows you to consider tradeoffs between risk and cost in your network. When you optimize the model, a set of output tables are populated that provide the risk scores per profile along with the percentage of total flow they affect. Each output table includes a Composite Risk Score that takes into account the weights applied to each of the individual risk scores:
-
Risk Summary - This output table provides risk scores at the risk profile level.
-
Site Risk Summary - This output table provides risk scores at the risk profile-site level.
-
Site Product Risk Summary - This output table provides risk scores at the risk profile-site-product level.
The Network Summary includes an overall Network Risk Health column that you can use to evaluate the high level effect of supplier risk mitigation strategies on your supply chain.
Enhanced spend constraints
Spend constraints have been enhanced to provide additional network costs that enable you to align the costs in your model to the financials of your business. The Network Cost column in the Spend Accounts table now includes the following values:
| Fixed Asset Cost | Unit Inventory Storage Cost | ||
| Fixed Resource Cost | Unit Inbound Warehousing Cost | ||
| Fixed Shipment Cost | Unit Outbound Warehousing Cost | ||
| Hourly Asset Cost | Unit Production Cost | ||
| Hourly Resource Cost | Unit Return Policy Cost | ||
| Inventory Holding Cost | Unit Site Demand Penalty Cost | ||
| Unit Customer Demand Penalty Cost | Unit Site Sourcing Cost | ||
| Unit Customer Sourcing Cost | Variable Transportation Cost |
Dynamic sourcing in Transportation Optimization
When you introduce a new customer or drop off point to your Transportation Optimization network, you may need to determine the source for the affected shipments. Previously, this required Network Optimization to answer sourcing questions. Dynamic sourcing in Transportation Optimization enables you to determine optimal sourcing locations for shipments without the need to run Network Optimization. For example, you can define shipments with no Origin value populated, then let Transportation Optimization optimize where the product needs to be picked up.
Use the new Shipment Sourcing table to identify which sites can act as sources for selected destinations. The destinations can be sites or customers. You select whether or not the source acts as a single source for the selected destinations.
In terms of site constraints, you can use the Maximum Capacity column in the Sites table to specify the maximum outbound quantity for each of the sites under consideration. The Fixed Startup Cost is used to track the cost incurred if a site is used as a source for one or more shipments and the Unit Production Cost column enables you to determine the variable production cost incurred based on the shipment throughput at the site.
The Site Sourcing Summary output table provided metrics in terms of the costs incurred based on the fixed and variable costs applied in the Sites table. The Transportation Summary includes a Total Sourcing Cost column, and the Shipment Output table provides the Allocated Sourcing Cost per shipment.
Fixed Startup Cost removed from Work Centers Multi-Period
The Fixed Startup Cost column is no longer displayed in the Work Centers Multi-Period table. This column was not in use, so it has been removed to prevent confusion.
Input Tables
|
Table |
Column |
Description of Change |
Model Database Table Name |
Model Database Column Name |
Data Type |
Required |
|---|---|---|---|---|---|---|
|
Input Tables |
||||||
|
Sites |
Risk Profile |
New column |
Sites |
RiskProfile |
Text |
No |
|
Unit Production Cost |
New column |
Sites |
UnitProductionCost |
Text |
No |
|
|
Risk Profiles |
Name |
New table/column |
RiskProfiles |
RiskProfileName |
Text |
Yes |
|
Financial Score |
New table/column |
RiskProfiles |
FinancialScore |
Float |
No |
|
|
Judicial Score |
New table/column |
RiskProfiles |
JudicialScore |
Float |
No |
|
|
News Sentiment Score |
New table/column |
RiskProfiles |
NewsSentimentScore |
Float |
No |
|
|
Screening List |
New table/column |
RiskProfiles |
ScreeningList |
Float |
No |
|
|
Residual Score |
New table/column |
RiskProfiles |
ResidualScore |
Float |
No |
|
|
Inherent Score |
New table/column |
RiskProfiles |
InherentScore |
Float |
No |
|
|
Business Continuity Score |
New table/column |
RiskProfiles |
BusinessContinuityScore |
Float |
No |
|
|
Performance Score |
New table/column |
RiskProfiles |
PerformanceScore |
Float |
No |
|
|
Labor Score |
New table/column |
RiskProfiles |
LaborScore |
Float |
No |
|
|
Geography Score |
New table/column |
RiskProfiles |
GeographyScore |
Float |
No |
|
|
Custom Score 1 |
New table/column |
RiskProfiles |
CustomScore1 |
Float |
No |
|
|
Custom Score 2 |
New table/column |
RiskProfiles |
CustomScore2 |
Float |
No |
|
|
Custom Score 3 |
New table/column |
RiskProfiles |
CustomScore3 |
Float |
No |
|
|
Financial Weight |
New table/column |
RiskProfiles |
FinancialWeight |
Float |
No |
|
|
Judicial Weight |
New table/column |
RiskProfiles |
JudicialWeight |
Float |
No |
|
|
News Sentiment Weight |
New table/column |
RiskProfiles |
NewsSentimentWeight |
Float |
No |
|
|
Screening List Weight |
New table/column |
RiskProfiles |
ScreeningListWeight |
Float |
No |
|
|
Residual Weight |
New table/column |
RiskProfiles |
ResidualWeight |
Float |
No |
|
|
Inherent Weight |
New table/column |
RiskProfiles |
InherentWeight |
Float |
No |
|
|
Business Continuity Weight |
New table/column |
RiskProfiles |
BusinessContinuityWeight |
Float |
No |
|
|
Performance Weight |
New table/column |
RiskProfiles |
PerformanceWeight |
Float |
No |
|
|
Labor Weight |
New table/column |
RiskProfiles |
LaborWeight |
Float |
No |
|
|
Geography Weight |
New table/column |
RiskProfiles |
GeographyWeight |
Float |
No |
|
|
Custom Weight 1 |
New table/column |
RiskProfiles |
CustomWeight1 |
Float |
No |
|
|
Custom Weight 2 |
New table/column |
RiskProfiles |
CustomWeight2 |
Float |
No |
|
|
Custom Weight 3 |
New table/column |
RiskProfiles |
CustomWeight3 |
Float |
No |
|
|
Custom Weight 4 |
New table/column |
RiskProfiles |
CustomWeight4 |
Float |
No |
|
|
Node Criticality Weight |
New table/column |
RiskProfiles |
NodeCriticalityWeight |
Float |
No |
|
|
Status |
New table/column |
RiskProfiles |
Status |
Text |
No |
|
|
Notes |
New table/column |
RiskProfiles |
Notes |
Text |
No |
|
|
Shipment Sourcing
|
Source Name |
New table/column |
ShipmentSourcing |
SourceName |
Text |
Yes |
|
Destination Name |
New table/column |
ShipmentSourcing |
DestinationName |
Text |
Yes |
|
|
Single Source |
New table/column |
ShipmentSourcing |
SingleSource |
Binary |
Yes |
|
|
Status |
New table/column |
ShipmentSourcing |
ShipmentSourceStatus |
Text |
No |
|
Output Tables
|
Table |
Column |
Description of Change |
Model Database Table Name |
Model Database Column Name |
Data Type |
|---|---|---|---|---|---|
|
Output Tables |
|||||
|
Risk Summary |
Risk Profile |
New table/column |
OptimizationOutputSupplierRiskSummary |
RiskProfileName |
Text |
|
Flow Quantity |
New table/column |
OptimizationOutputSupplierRiskSummary |
FlowQuantity |
Float |
|
|
% Total Flow |
New table/column |
OptimizationOutputSupplierRiskSummary |
FlowPercent |
Float |
|
|
Financial Score |
New table/column |
OptimizationOutputSupplierRiskSummary |
FinancialScore |
Float |
|
|
Judicial Score |
New table/column |
OptimizationOutputSupplierRiskSummary |
JudicialScore |
Float |
|
|
News Sentiment Score |
New table/column |
OptimizationOutputSupplierRiskSummary |
NewsSentimentScore |
Float |
|
|
Screening List |
New table/column |
OptimizationOutputSupplierRiskSummary |
ScreeningList |
Float |
|
|
Residual Score |
New table/column |
OptimizationOutputSupplierRiskSummary |
ResidualScore |
Float |
|
|
Inherent Score |
New table/column |
OptimizationOutputSupplierRiskSummary |
InherentScore |
Float |
|
|
Business Continuity Score |
New table/column |
OptimizationOutputSupplierRiskSummary |
BusinessContinuityScore |
Float |
|
|
Performance Score |
New table/column |
OptimizationOutputSupplierRiskSummary |
PerformanceScore |
Float |
|
|
Labor Score |
New table/column |
OptimizationOutputSupplierRiskSummary |
LaborScore |
Float |
|
|
Geography Score |
New table/column |
OptimizationOutputSupplierRiskSummary |
GeographyScore |
Float |
|
|
Custom Score 1 |
New table/column |
OptimizationOutputSupplierRiskSummary |
CustomScore1 |
Float |
|
|
Custom Score 2 |
New table/column |
OptimizationOutputSupplierRiskSummary |
CustomScore2 |
Float |
|
|
Custom Score 3 |
New table/column |
OptimizationOutputSupplierRiskSummary |
CustomScore3 |
Float |
|
|
Custom Score 4 |
New table/column |
OptimizationOutputSupplierRiskSummary |
CustomScore4 |
Float |
|
|
Composite Risk Score |
New table/column |
OptimizationOutputSupplierRiskSummary |
CompositeRiskScore |
Float |
|
|
Scenario ID |
New table/column |
OptimizationOutputSupplierRiskSummary |
ScenarioID |
Int |
|
|
Sub-Scenario ID |
New table/column |
OptimizationOutputSupplierRiskSummary |
StepNumber |
Int |
|
|
Site Risk Summary |
Risk Profile |
New table/column |
OptimizationOutputSiteRiskSummary |
RiskProfileName |
Text |
|
Site |
New table/column |
OptimizationOutputSiteRiskSummary |
SiteName |
Text |
|
|
Flow Quantity |
New table/column |
OptimizationOutputSiteRiskSummary |
FlowQuantity |
Text |
|
|
% Total Flow |
New table/column |
OptimizationOutputSiteRiskSummary |
FlowPercent |
Float |
|
|
Financial Score |
New table/column |
OptimizationOutputSiteRiskSummary |
FinancialScore |
Float |
|
|
Judicial Score |
New table/column |
OptimizationOutputSiteRiskSummary |
JudicialScore |
Float |
|
|
News Sentiment Score |
New table/column |
OptimizationOutputSiteRiskSummary |
NewsSentimentScore |
Float |
|
|
Screening List |
New table/column |
OptimizationOutputSiteRiskSummary |
ScreeningList |
Float |
|
|
Residual Score |
New table/column |
OptimizationOutputSiteRiskSummary |
ResidualScore |
Float |
|
|
Inherent Score |
New table/column |
OptimizationOutputSiteRiskSummary |
InherentScore |
Float |
|
|
Business Continuity Score |
New table/column |
OptimizationOutputSiteRiskSummary |
BusinessContinuityScore |
Float |
|
|
Performance Score |
New table/column |
OptimizationOutputSiteRiskSummary |
PerformanceScore |
Float |
|
|
Labor Score |
New table/column |
OptimizationOutputSiteRiskSummary |
LaborScore |
Float |
|
|
Geography Score |
New table/column |
OptimizationOutputSiteRiskSummary |
GeographyScore |
Float |
|
|
Custom Score 1 |
New table/column |
OptimizationOutputSiteRiskSummary |
CustomScore1 |
Float |
|
|
Custom Score 2 |
New table/column |
OptimizationOutputSiteRiskSummary |
CustomScore2 |
Float |
|
|
Custom Score 3 |
New table/column |
OptimizationOutputSiteRiskSummary |
CustomScore3 |
Float |
|
|
Custom Score 4 |
New table/column |
OptimizationOutputSiteRiskSummary |
CustomScore4 |
Float |
|
|
Composite Risk Score |
New table/column |
OptimizationOutputSiteRiskSummary |
CompositeRiskScore |
Float |
|
|
Scenario ID |
New table/column |
OptimizationOutputSiteRiskSummary |
ScenarioID |
Int |
|
|
Sub-Scenario ID |
New table/column |
OptimizationOutputSiteRiskSummary |
StepNumber |
Int |
|
|
Site Product Risk Summary |
Risk Profile |
New table/column |
OptimizationOutputProductRiskSummary |
RiskProfileName |
Text |
|
Site |
New table/column |
OptimizationOutputProductRiskSummary |
SiteName |
Text |
|
|
Product |
New table/column |
OptimizationOutputProductRiskSummary |
ProductName |
Text |
|
|
Flow Quantity |
New table/column |
OptimizationOutputProductRiskSummary |
FlowQuantity |
Text |
|
|
% Total Flow |
New table/column |
OptimizationOutputProductRiskSummary |
FlowPercent |
Float |
|
|
Financial Score |
New table/column |
OptimizationOutputProductRiskSummary |
FinancialScore |
Float |
|
|
Judicial Score |
New table/column |
OptimizationOutputProductRiskSummary |
JudicialScore |
Float |
|
|
News Sentiment Score |
New table/column |
OptimizationOutputProductRiskSummary |
NewsSentimentScore |
Float |
|
|
Screening List |
New table/column |
OptimizationOutputProductRiskSummary |
ScreeningList |
Float |
|
|
Residual Score |
New table/column |
OptimizationOutputProductRiskSummary |
ResidualScore |
Float |
|
|
Inherent Score |
New table/column |
OptimizationOutputProductRiskSummary |
InherentScore |
Float |
|
|
Business Continuity Score |
New table/column |
OptimizationOutputProductRiskSummary |
BusinessContinuityScore |
Float |
|
|
Performance Score |
New table/column |
OptimizationOutputProductRiskSummary |
PerformanceScore |
Float |
|
|
Labor Score |
New table/column |
OptimizationOutputProductRiskSummary |
LaborScore |
Float |
|
|
Geography Score |
New table/column |
OptimizationOutputProductRiskSummary |
GeographyScore |
Float |
|
|
Custom Score 1 |
New table/column |
OptimizationOutputProductRiskSummary |
CustomScore1 |
Float |
|
|
Custom Score 2 |
New table/column |
OptimizationOutputProductRiskSummary |
CustomScore2 |
Float |
|
|
Custom Score 3 |
New table/column |
OptimizationOutputProductRiskSummary |
CustomScore3 |
Float |
|
|
Custom Score 4 |
New table/column |
OptimizationOutputProductRiskSummary |
CustomScore4 |
Float |
|
|
Composite Risk Score |
New table/column |
OptimizationOutputProductRiskSummary |
CompositeRiskScore |
Float |
|
|
Scenario ID |
New table/column |
OptimizationOutputProductRiskSummary |
ScenarioID |
Int |
|
|
Sub-Scenario ID |
New table/column |
OptimizationOutputProductRiskSummary |
StepNumber |
Int |
|
|
Network Summary |
Network Risk Health |
New column |
OptimizationOutputNetworkSummary |
NetworkRiskHealth |
Float |
|
Transportation Summary |
Total Sourcing Cost |
New column |
VehicleRouteOptimizationSummary |
TotalSourcingCost |
Money |
|
Shipment Output |
Allocated Sourcing Cost |
New column |
VRPOutputShipmentOutput |
AllocatedSourcingCost |
Money |
|
Site Sourcing Summary
|
Site Name |
New table/column |
SiteSourcingSummary |
SiteName |
Text |
|
Total Sourcing Cost |
New table/column |
SiteSourcingSummary |
TotalSourcingCost |
Money |
|
|
Total Fixed Startup Cost |
New table/column |
SiteSourcingSummary |
TotalFixedStartupCost |
Money |
|
|
Total Variable Production Cost |
New table/column |
SiteSourcingSummary |
TotalVariableProductionCost |
Money |
|
|
Scenario ID |
New table/column |
SiteSourcingSummary |
ScenarioID |
Int |
|
|
Sub-Scenario ID |
New table/column |
SiteSourcingSummary |
StepNumber |
Int |
|
This table lists parameters that have been added to the Advanced Parameter Tables for the various technologies:
|
Technology |
Parameter name |
Parameter value |
Description |
Enter parameter manually |
|---|---|---|---|---|
|
Transportation Optimization |
Optimize Dynamic Sourcing |
TRUE |
Use the network optimization MIP (mixed integer program) solver to optimize the sourcing decisions based on cost and capacity. |
Yes |
Supply Chain Homepage
Model Building
SCDP 33.5.0 Location_type reported in the Notes column
The Notes column in the model's Customers and Sites tables is now populated with the location_type value from the DDM locations_dimension table.
SCDP 33.4.0 Additional recipe workspace tables to extend model building features
You can generate DDM workspace tables associated with model recipes to extend the capabilities of the current Model Building features. For example, you may want to use data in your DDM to populate additional model tables not yet included in the Model Building workflow, such as adding Production Constraints. With this feature, additional DDM workspace tables are generated when you run your model recipe. You can use macros to perform joins, aggregations and calculations on both the standard DDM tables and the recipe workspace tables to insert data into your model tables.
A new Quick Start has been added with an example of how to use the new recipe workspace tables to add Production Constraints to your model.
SCDP 33.2.0 Availability of advanced policy and constraint generation
Authorized users now have access to the advanced policy and constraint generation features in Model Building. You can use these features to define how products are being produced, sourced, stored and transported through your supply chain network. See "Advanced policy and constraint generation" below for additional information.
Model recipe building interface updates
When creating and editing model recipes, the workflow now uses an intuitive navigation tree that guides you through the step-by-step process. The tree provides nodes that can be expanded and collapsed as needed to complete the recipe definition. As you populate required information, additional nodes become available. You can navigate using the Next and Back buttons, or click directly on the node you want to access.
Advanced policy and constraint generation
Model building recipes include advanced policy and constraint generation features that enable you to create model recipes that more accurately represent your supply chain using a simple workflow. You can use these features to define how products are being produced, sourced, stored and transported through your supply chain network.
For each category, you determine the capabilities to control how policies are constructed. For example, when defining Customer Lanes Capabilities, you select the DDM table that is the source for the model policies. In addition, you select how multiple sources for a customer and multiple modes on a lane should be handled. You can also determine whether the policies are product-specific.
Once the capabilities are defined, the flexible model recipe lets you bring in costs from different sources. For example, some costs may be defined in the transactional data while others are imported from a pre-defined lookup table. Select the source to define Sourcing Costs for the Customer Lanes. Use Transportation Costs to determine the source, calculation method and cost basis for your basic transportation costs.
You can then proceed with the capability and cost definitions for Site Lanes, Production and Inventory to create a recipe that will result in models that align with your real world supply chain.
Prepended identifier for aggregated customers
When you are aggregating Customers in your model recipe, the aggregated values will now be prepended with "CZ_". This prevents aggregated Sites and aggregated Customers from having the same name. For example, if you are aggregating both entities by primary_country, the Site will have a name such as "Mexico" and the Customer will have "CZ_Mexico" making these names unique in the model database.
Delimiter selection for aggregated names
When aggregating elements, you can now select the delimiter to use in the aggregated names. This is one of underscore, hyphen, dot or vertical line. The delimiter applies to all elements in your model recipe.
Data Management
Confirmation required when closing browser tab during upload
If an upload is in progress, and an attempt is made to close the Supply Chain browser tab or the window containing the tab, a message is displayed indicating that the upload will be terminated as a result of closing the browser tab or window. In the message, you can confirm or cancel the closing of the tab or window, and you can also choose to prevent this message from being displayed in the future.
Queue Management
Sort by any queue management column
Any user can sort the queue list by any column, in ascending or descending order.
Stop Run restricted to solve creator
Non-admin users can see queues of any models for which they have permissions; however, only the user who submitted the model solve (the creator of the solve) has access to the Stop Run button.
Supply Chain API
New endpoints
- SCDP 33.4.0 POST /v4/model/{modelId}/scenarios/bulk
Creates multiple scenarios in a specified model.
- POST /v4/model/{modelId}/table
Creates a table in a specified model.
- POST /v4/model/{modelId}/table/{tableName}/column
Creates a column in a specified table in a specified model.
- GET /v4/model/{modelId}/table/{tableName}/filters
Returns a list containing the filters in a specified model.
- POST /v4/model/{modelId}/table/{tableName}/filters
Creates a filter in a specified model, for the table specified in the path. This endpoint is available for a limited number of users. You can create filters using the Supply Chain interface.
- GET /v4/model/{modelId}/table/{tableName}/filters/{filterName}
Returns the requested filter in a given model.
- PUT /v4/model/{modelId}/table/{tableName}/filters/{filterName}
Updates the specified filter in a specified model. This endpoint is available for a limited number of users. You can create filters using the Supply Chain interface.
- DELETE /v4/model/{modelId}/table/{tableName}/filters/{filterName}
Deletes the requested filter in a specified model.
- GET /v4/msa/demandmodeler
Returns a list of assets.
- GET /v4/msa/demandmodeler/{assetId}
Returns a list of tables in an asset, given the asset ID.
- GET /v4/msa/demandmodeler/{assetId}/table/{tableName}
Returns metadata in an asset table, given the asset ID and table name.
- GET /v4/msa/demandmodeler/{assetId}/table/{tableName}/record
Returns records in an asset table, given the asset ID and table name.
- POST /v4/msa/demandmodeler/{assetId}/table/{tableName}/record
Truncates and adds data in an asset table, given the asset ID, the table name, and a body of records to be inserted or updated.
- PATCH /v4/msa/demandmodeler/{assetId}/table/{tableName}/record
Inserts or updates data in an asset table, given the asset ID, the table name, and a body of records to be inserted or updated.
- DELETE /v4/msa/demandmodeler/{assetId}/table/{tableName}/record
Deletes data from an asset table, given the asset identifier, the table name, and a body of identifiers to be deleted.
- PUT /v4/msa/demandmodeler/{assetId}/table/{tableName}/truncate
Truncates data in an asset table, given the asset ID and table name.
App Studio
Grid Widget enhancements
The following enhancements have been made to the Grid widget:
- Boolean columns can be displayed as a toggle switch.
- Column sorting and filtering can be enabled or disabled.
- Borders can be removed from the grid.
- The vertical scroll bars can be turned off.
- Row highlighting when users hover over a row can be disabled.
- A new multi-select option allows users to select multiple items from a list.
Note: This feature is controlled by a Coupa feature toggle and needs to be enabled by Coupa for users to see it.
Modeler
Spend constraints
Spend constraints provide a way for you to align the costs in your model to the financials of your business. You can identify budget constraints and combine various supply chain costs to adhere to those constraints. The outputs from spend constraints give you an efficient way to analyze the budget vs spend in your supply chain.
Use this feature to model spend constraints that are respected by Network Optimization. For example, you can provide a maximum budget of $25,000,000 for supply chain site operating cost spend. The solver must optimize the network design without exceeding this spend budget. Constraints can be defined at an individual element level or group level, enabling you to control exactly which elements are covered by the constraint, such as limiting transportation spend for selected modes.
You control spend constraints using two input tables: Spend Accounts and Spend Expressions. Utilization information for these accounts and expressions is provided in the Network Spend Account Summary and Network Spend Expression Summary output tables.
Model complexity and solve time prediction
When running Network Optimization models, it can be hard to know the complexity of the problem and how long it will take to solve. The solve process now includes a method to both identify a solve time range and highlight complexities in the model that may contribute to longer solve times. This information can help you understand what drives model complexity and how this affects solve times. For this release, the predictive information is included in the solver log that is available in Queue Management.
Updated Network Optimization solver
The Network Optimization solver has been updated to achieve uniformity in the solver language between Network Optimization, Inventory Optimization and Transportation Optimization.
Minimum units for asset availability
In the Asset Availability table, you can specify the minimum number of vehicles that Transportation Optimization must use in routing shipments. Use the Minimum Units column to set this minimum for the specific asset availability record.
Improved geocoding
Geocoding has been improved for some cases. For example, when specifying a State, 3-digit Postal Code, and Country, results are now significantly more accurate than in previous releases.
Model database changes
Input Tables
|
Table |
Column |
Description of Change |
Model Database Table Name |
Model Database Column Name |
Data Type |
Required |
|---|---|---|---|---|---|---|
|
Input Tables |
||||||
|
Asset Availability |
Minimum Units |
New column |
AssetAvailability |
MinimumQty |
Int |
No |
|
Spend Accounts |
Name |
New table/column |
SpendAccounts |
SpendAccountName |
Text |
Yes |
|
Spend Accounts |
Network Cost |
New table/column |
SpendAccounts |
NetworkCost |
Text |
Yes |
|
Spend Accounts |
Max Spend |
New table/column |
SpendAccounts |
MaxSpend |
Text |
No |
|
Spend Accounts |
Period |
New table/column |
SpendAccounts |
PeriodName |
Text |
No |
|
Spend Accounts |
Location |
New table/column |
SpendAccounts |
LocationName |
Text |
No |
|
Spend Accounts |
Product |
New table/column |
SpendAccounts |
ProductName |
Text |
No |
|
Spend Accounts |
Source |
New table/column |
SpendAccounts |
SourceName |
Text |
No |
|
Spend Accounts |
Mode |
New table/column |
SpendAccounts |
ModeName |
Text |
No |
|
Spend Accounts |
Work Center |
New table/column |
SpendAccounts |
WorkCenterName |
Text |
No |
|
Spend Accounts |
Work Resource |
New table/column |
SpendAccounts |
WorkResourceName |
Text |
No |
|
Spend Accounts |
Process |
New table/column |
SpendAccounts |
ProcessName |
Text |
No |
|
Spend Accounts |
Process Step |
New table/column |
SpendAccounts |
ProcessStepName |
Text |
No |
|
Spend Accounts |
Next Process Step |
New table/column |
SpendAccounts |
NextProcessStepName |
Text |
No |
|
Spend Accounts |
Bill Of Material |
New table/column |
SpendAccounts |
BOMName |
Text |
No |
|
Spend Accounts |
Transportation Asset |
New table/column |
SpendAccounts |
TransportationAssetName |
Text |
No |
|
Spend Accounts |
Expression |
New table/column |
SpendAccounts |
ExpressionName |
Text |
No |
|
Spend Accounts |
Status |
New table/column |
SpendAccounts |
Status |
Text |
No |
|
Spend Accounts |
Notes |
New table/column |
SpendAccounts |
Notes |
Text |
No |
|
Spend Expressions |
Name |
New table/column |
SpendExpressions |
SpendExpressionName |
Text |
Yes |
|
Spend Expressions |
Element |
New table/column |
SpendExpressions |
Element |
Text |
Yes |
|
Spend Expressions |
Value |
New table/column |
SpendExpressions |
Value |
Float |
Yes |
|
Spend Expressions |
Status |
New table/column |
SpendExpressions |
Status |
Text |
No |
|
Spend Expressions |
Notes |
New table/column |
SpendExpressions |
Notes |
Text |
No |
Output Tables
|
Table |
Column |
Description of Change |
Model Database Table Name |
Model Database Column Name |
Data Type |
|---|---|---|---|---|---|
|
Output Tables |
|||||
|
Network Spend Account Summary |
Spend Account |
New table/column |
NetworkSpendAccountSummary |
SpendAccountName |
Text |
|
Cost Type |
New table/column |
NetworkSpendAccountSummary |
CostType |
Text |
|
|
Period |
New table/column |
NetworkSpendAccountSummary |
PeriodName |
Text |
|
|
Location |
New table/column |
NetworkSpendAccountSummary |
LocationName |
Text |
|
|
Product |
New table/column |
NetworkSpendAccountSummary |
ProductName |
Text |
|
|
Source |
New table/column |
NetworkSpendAccountSummary |
SourceName |
Text |
|
|
Mode |
New table/column |
NetworkSpendAccountSummary |
ModeName |
Text |
|
|
Work Center |
New table/column |
NetworkSpendAccountSummary |
WorkCenterName |
Text |
|
|
Work Resource |
New table/column |
NetworkSpendAccountSummary |
WorkResourceName |
Text |
|
|
Transportation Asset |
New table/column |
NetworkSpendAccountSummary |
TransportationAssetName |
Text |
|
|
Process |
New table/column |
NetworkSpendAccountSummary |
ProcessName |
Text |
|
|
Process Step |
New table/column |
NetworkSpendAccountSummary |
ProcessStepName |
Text |
|
|
Next Process Step |
New table/column |
NetworkSpendAccountSummary |
NextProcessStepName |
Text |
|
|
Bill Of Material |
New table/column |
NetworkSpendAccountSummary |
BOMName |
Text |
|
|
Expression |
New table/column |
NetworkSpendAccountSummary |
ExpressionCostName |
Text |
|
|
Total Spend |
New table/column |
NetworkSpendAccountSummary |
TotalSpend |
Float |
|
|
Max Budget |
New table/column |
NetworkSpendAccountSummary |
MaxBudget |
Float |
|
|
Remaining Budget |
New table/column |
NetworkSpendAccountSummary |
RemainingBudget |
Float |
|
|
Budget Utilization |
New table/column |
NetworkSpendAccountSummary |
BudgetUtilization |
Float |
|
|
Scenario ID |
New table/column |
NetworkSpendAccountSummary |
ScenarioID |
Int |
|
|
Sub-Scenario ID |
New table/column |
NetworkSpendAccountSummary |
StepNumber |
Int |
|
|
Network Spend Expression Summary |
Spend Expression |
New table/column |
NetworkSpendExpressionSummary |
SpendExpressionName |
Text |
|
# Accounts Considered |
New table/column |
NetworkSpendExpressionSummary |
NumAccounts |
Text |
|
|
Constraint Type |
New table/column |
NetworkSpendExpressionSummary |
ConstraintType |
Text |
|
|
Total Spend |
New table/column |
NetworkSpendExpressionSummary |
TotalSpend |
Float |
|
|
Constraint Value |
New table/column |
NetworkSpendExpressionSummary |
ConstraintValue |
Float |
|
|
Constraint Excess |
New table/column |
NetworkSpendExpressionSummary |
ConstraintExcess |
Float |
|
|
% Constraint Utilized |
New table/column |
NetworkSpendExpressionSummary |
PercentConstraintUtilized |
Float |
|
|
Scenario ID |
New table/column |
NetworkSpendExpressionSummary |
ScenarioID |
Int |
|
|
Sub-Scenario ID |
New table/column |
NetworkSpendExpressionSummary |
StepNumber |
Int |
|
Supply Chain Homepage
Model Building
Policy generation
Model building supports policy generation to create production, sourcing, transportation and inventory policies. The Generate Policies dropdown includes the following policy generation options:
-
No Policy Generation - No policies are generated in the model tables.
-
Generate from Orders - Policies are generated based on the records in the orders_full DDM table selected in the recipe.
-
Generate from Shipments - Policies are generated based on the records in the shipments_full DDM table selected in the recipe.
-
Generate from DDM Policies - Policies are generated using data in the production_policies, sourcing_policies, shipment_lanes and inventory_policies tables in the DDM.
Constraint generation
Model building supports the generation of flow constraints based on the transactions table used to populate Customer Orders (Orders Full or Shipments Full). Turn on the Generate Constraints toggle to enable Flow Constraints to be built from the transactional data.
Model options set during model building
These options are set during model building:
-
Model Horizon start and end date - These are controlled based on the Time Horizon settings in the model recipe:
-
For Fixed Horizon, the model horizon uses the Start Date and End Date selected in the recipe.
-
For Rolling Horizon, the recipe finds the most recent "Last Number of Days of Transactional Data" in the source for the Customer Orders and sets the model horizon accordingly. For example, if you have orders that occur every calendar day in 2021 and enter 31 as the "Last Number of Days of Transactional Data", the model horizon will be 12/01/2021 to 12/31/2021.
-
-
Customer Model Demand - This is an option on the General tab of Network Optimization Options. It is set to "Run from Orders table" to make use of Customer Orders as the transactional source.
Decision Data Model selection
When defining a model recipe, the Decision Data Model field supports typing characters to narrow the DDM name search.
Supply Chain API
- DELETE /v4/model/{modelId}
Deletes the model with the specified identifier.
- POST /v4/model/{modelId}/copy
Copies the model with the specified identifier.
- GET /v4/model/{modelId}/scenario/{scenarioId}
Returns the requested scenario in the specified model.
- GET /v4/model/{modelId}/scenarioItems
Returns a list containing the scenario items in the specified model.
- POST /v4/model/{modelId}/scenarioItems/bulk
Creates one or more scenario items in the model with the specified identifier.
- GET /v4/model/{modelId}/scenarios
Returns a list containing the scenarios in the specified model.
- POST /v4/model/{modelId}/scenarios
Creates a scenario in the specified model.
- POST /v4/model/{modelId}/solve/{solveType}
Solves one or more scenarios for the specified model.
- DELETE /v4/model/name/{modelName}
Deletes a model with the specified name.
- GET /v4/modelqueue/{queueId}
Returns a model queue by its unique identifier.
- GET /v4/modelqueue/{queueId}/logs
Returns a paginated list of model logs from the specified model queue.
App Studio
SCDP 31.1.0 New Run Model Recipe action
A new Technology action has been added to allow you to run existing model recipes as part of a macro.
Map Widget Improvements
The Map widget can now include a legend, and map points can be scaled by a database column such as stock or demand.
Insert Action Improvements
The Insert action has been improved to make adding columns easier. You can pick a table from a data source connection and add columns quickly from the table. Columns whose name and data type match between the source and destination will be automatically mapped, which speeds up the process.
Conditional Formatting Improvements
Conditional formatting in widgets has been improved to provide more features and increase ease of use. You can now:
- Review and edit existing conditional formatting rules.
- Apply rules to multiple columns at once.
- Choose to use your own conditional rules or the rules provided by the builder.
- Use conditional formatting based on dynamic values.
- Control the Icon widget's colors. The background color, icon color, and font color can each be conditionally controlled to convey information.
Using Functions in the Sort By and Conditions Fields of Widgets
You can now use Aggregate functions in the Sort By and Conditions fields of widgets.
Modeler
SCDP 31.3.0 Supply Chain Design-to-Source Events
Once market information has been gathered in a Coupa Sourcing Optimization (CSO) event, the data is made available by the CSO sourcing manager. You can then refresh the sourcing events in Modeler and review the data provided by CSO. The data includes the CSO scenario, along with the source, destination, temperature class and hazardous goods values that identify the lane. In addition, information regarding the supplier, rates and equipment is provided.
Supply Chain Design-to-Source
When supply chain design and strategic sourcing teams work in silos, they miss opportunities to create and enhance supply-chain models that account for real-time market pricing or leverage aggregated volumes in supplier negotiations.
The Design-to-Source workflow provides an integrated approach to gathering and applying real-world truckload transportation lane costing to a Supply Chain network design based on market information gathered from a Coupa Sourcing Optimization (CSO) event. This workflow drives further cost savings and bridges the gap between strategy and execution.
In this workflow, Supply Chain modelers identify lanes based on their optimized networks and send this data as sourcing requests. Within Modeler, you can view and filter the model data to be used as a transportation data set. When the modeler sends a Sourcing Request for these lanes, a CSO sourcing manager will receive this data set in Data Exchange where it can be leveraged in a sourcing event.
Product attributes for transportation
New columns have been added to the Products table to track additional attributes about each product in terms of specific transportation requirements. In Modeler, these values are used in the Design to Source Integration for Truckload Transportation. You can also use these columns to filter your product data outside the Design to Source Integration:
| Name | Description |
|---|---|
| Temperature Class |
Defines the class of temperature control required for the product. Select one of:
|
| Hazardous Goods | Indicates whether or not the product is considered a hazardous material. |
Improved output processing in model solves
The Supply Chain platform enables you to solve multiple scenarios simultaneously, saving significant time over solving one scenario at a time. It also offers robust resources to solve large, complex models. The way in which scenario output is processed has been enhanced to increase reliability and prevent database "deadlocking" when processing solver output. The solver provides results which are then merged and written to the output tables in a new Merge Results step. Merge Results has been added to the Queue Management Logs. This improvement most noticeably affects output processing of large numbers of scenarios from a single model. Results may be merged in batches; you will receive notification of scenario completion as the associated batch merge is completed.
Cancellation is not supported during the Merge Results step.
New integration navigation section
An integration section has been added to the left navigation pane in Modeler: ![]() . Features that integrate Modeler with other applications, such as Supply Chain Design-to-Source and the Tableau Web Data Connector, are located in this section.
. Features that integrate Modeler with other applications, such as Supply Chain Design-to-Source and the Tableau Web Data Connector, are located in this section.
Supply Chain Home page
Model Building Workflow
SCDP 31.3.0 Duplicate recipe now provides a default name value. The default name is the original recipe name appended with a unique number.
SCDP 31.3.0 A confirmation has been added if a model will be overwritten when a recipe is run.
SCDP 31.2.0 You can use the streamlined Cloud-based model building workflow to create models using data from the Decision Data Model (DDM). This workflow provides a quick start for modeling. It enables repeatability and faster model building using the most current DDM data. This can help to reduce implementation time.
The initial model building workflow supports Greenfield Analysis and basic Network Optimization distribution models, with additional Network Optimization capabilities and other use cases coming in future releases. This workflow enables you to define model recipes that tailor data selection based on your supply chain design study. You can filter locations, products, and other entities, and define the time horizon to be applied to the transactional data in your model. Aggregation strategies for entities enhance your ability to analyze tradeoffs.
Data Management
Data Viewer
You can display data contained in a Decision Data Model or user-defined database using the Data Viewer, which is accessed from the asset's context menu. This feature eliminates the need to open App Studio, create a grid, and then connect to the data you want to view.
Queue Management
Merge Results solve step
For models, a new step been added to the design engine solve process to more accurately reflect how solve output populates model database tables. This step is included on Queue Management's Design Engines tab as well as the Logs tab.
When running scenarios, output is stored in temporary tables before being merged into the model database tables. Previously, the Results step indicated that the output was pulled into the output tables. Now, that step indicates that the temporary tables have been populated. The new step, Merge Results, populates the standard output tables and then clears the temporary tables.
Custom Algorithms tab renamed
To improve consistency and accuracy in the user experience, the Custom Algorithms tab has been renamed to Tasks.
Task log limitation
Logs for task are limited to 10MB. When that limit is reached, older records are replaced by newer records as the new ones are added.
Filter queues by status
You can filter queues by status to help limit your list to only those queues you are interested in viewing. You can also include more than one status in the filter.
Queues limited to past 30 days
To enhance query performance, the queue list now displays only those queues from the prior 30 days.
App Studio
Import and Export Data to/from Local Excel Files via a Macro Action
App users can import data from Excel workbooks using an App Studio macro. This allows easier import of data from multiple Excel sheets, which simplifies the process for importing ad hoc data into your apps.
Export Apps with Assets
To make moving an app easier, you can export an app’s assets from Data Management in addition to the app definition. When you export an app, you will receive an email that includes a link for downloading the app and its assets. This allows easier portability of apps and creating app templates.
Grid Widget Enhancements
The Grid widget is being enhanced to make it more flexible and useful. It will now:
- Allow users to select entries from a database lookup table. This makes data entry more consistent.
- Allow the grid to be filtered based on lookup table entries. This allows the Designer to provide user-specific drop down values. For example, a user would select from a list of suppliers that are applicable to the user.
- Save hidden column values if they are defaults, and not if they are auto-incremented. This increases data accuracy.
- Allow the Designer to establish grouping for a grid that will appear when the grid is opened. This supports more organized presentation of data.
- Allow subtotals for columns and groupings.
Edit in Excel Enhancements
Edit in Excel includes several new Grid widget features, making it more useful and more consistent with the Grid widget. It will now:
- Allow users to select entries from a database lookup table.This makes data entry more consistent.
- Allow the worksheet to be filtered based on lookup table entries. This allows the Designer to provide user-specific drop down values. For example, a user would select from a list of suppliers that are applicable to the user.
- Enforce validation rules when saving. This increases data accuracy.
- Commit default values back to the grid when saving (including for hidden columns and non-global variables). This increases data accuracy.
Parameter Prompts Translation Support
Parameter prompts can be translated. This will assist with multi-lingual support.
Pass Parameters via URLs
You can share a scenario with other users by sharing a link to the scenario via email. This assists iterative collaboration based on model results. This is particularly helpful when there are too many scenarios available to easily pick from a list of available scenarios.
Clickable Icons with Tooltips
Icons are customizable to make them more useful and attractive. The Designer can:
- Add an icon color and a background color.
- Control font size, color, and style (bold or italic).
- Control vertical and horizontal placement of the icon.
- Add a tooltip to the icon.
Run Custom Algorithms
App designers can now run custom algorithms to analyze their data. The new Run Custom Algorithm action enables designers to add a custom algorithm to a macro for execution on models or custom databases. Detailed logging of custom algorithm runs is available in queue management.
Modeler
Simulation engine support SCDP 30.2
The Simulation engine supports additional functionality not available in Classic Simulation. These features include:
-
Material requirements planning (MRP) - This is a production planning, scheduling and inventory control system used to manage manufacturing processes. MRP ensures that the correct quantity of a product is available at a point in time.
-
State Management - This enables you to control the state of a site (open or closed) in the network. As a result, you can model nodes in the network with different cadences and with different business hours (as opposed to open 24 hours a day, 7 days a week). You can also define separate business hours for specific activities (load, unload, production).
This Simulation engine is also more efficient than Classic Simulation, using agent-based simulation methodologies.
Both the "Simulation" and "Classic Simulation" problem types are now supported when solving in Modeler.
Hidden numeric columns are removed from uploaded models SCDP 30.1
Models created in Supply Chain Guru X include hidden numeric columns that are used for sorting and summing values in the Supply Chain Guru X interface. These columns are not currently used in Modeler and can add to the time required to upload the model. The hidden numeric columns are now removed when you upload a model from Supply Chain Guru X to Modeler.
Clear scenario results
Modelers want to clear output data from a model for a variety of reasons. For example, you may want to focus on a subset of all scenarios that are the candidates to carry forward in your design study. In addition, scenario results can occupy a lot of storage, so when transitioning the model out of the platform, you may not want to include scenario results. Modeler now includes a feature that lets you clear all output data from your model.
Multi-Stop Estimation output populated
When you run a Network Optimization model that includes Multi-Stop Estimation, the various output tables for Multi-Stop Estimation are now correctly populated. This includes Multi-Stop Estimation Summary and Multi-Stop Estimation Cost Matrix.
Time series statistics for Simulation
Time series statistics provide details about inventory value and units, order cycle time, backorder units and other statistics for points in time throughout the Simulation horizon. The Simulation options now include options that you use to control which time series statistics output tables are populated when running Simulation. You will find the time series statistics options on the Detailed Output tab in the Simulation options.
Transportation Optimization Solver Setting
The Solver Setting option enables you to control the effort factor used during Transportation Optimization, with a solution quality vs. solve time tradeoff. This option is found on the General tab in the Transportation Optimization options. The different Solver Setting values adjust multiple parameters to collectively control the heuristic search-space. The value you select (one of Fastest, Fast, Balanced, Expanded or Detailed) is now displayed in the Solver Setting column in the Transportation Summary output table.
Out of Route output information
Two columns have been added to the Route Summary output table to report out of route information for Transportation Optimization. Out Of Route Distance displays the total out of route distance for the route, and Out of Route Cost displays the cost incurred based on the out of route distance.
Adjustments to grouped records in constraints tables
In previous versions of Modeler, constraints that are not used with Network Optimization based on their structure were being written to the input files. This could result in excessive time to build the input files. During input file generation, Modeler now checks for specific conditions and ignores constraint records that satisfy all of these conditions:
-
Record contains an Expression Name.
-
Record has a group applied to one or more columns that support groups, such as Source, Destination and Product.
-
Record has a Constraint Type of "Define".
If records meet all these conditions, information about the records is written to ErrorLog.txt in order to help diagnose the issue. In general, Coupa recommends that you avoid building constraints using nested expressions with groups.
Intelligent input file generation for cost data
As described above, the optimization algorithms do not handle nested expressions where groups are used for sites, customers or products. When these expressions are defined, the model can fail or be returned as a complex infeasible model that is difficult to troubleshoot. Some of these issues stem from the way cost data is written when generating input files. Logic has been added to skip the records that would result in nested expressions containing groups, preventing failures and infeasibilities that could be caused by these records and the associated cost data.
If records are skipped for this condition, information about the records is written to ErrorLog.txt in order to help diagnose the issue. In general, Coupa recommends that you avoid building constraints using nested expressions with groups.
Web Data Connector performance improvements
When loading table data with the Tableau Web Data Connector, performance has been significantly improved. This affects tables with more than 1000 rows.
Solves are limited to supported model versions
In previous versions of Modeler, when solving using a model version that is unsupported in the Supply Chain platform, the model was queued but never processed by a design engine. These models could remain in the queue for 35 days. This condition could occur when cloud solving or solving using App Studio. This has been changed so that solves with invalid model versions are never started.
|
Table |
Column |
Description of Change |
Model Database Table Name |
Model Database Column Name |
|---|---|---|---|---|
|
Input Tables |
||||
|
Inventory Policies |
Forecast Aggregation Period |
New column |
InventoryPolicies |
ForecastAggregationPeriod |
|
Inventory Policies |
Forecast Disaggregation Pattern |
New column |
InventoryPolicies |
ForecastDisaggregationPattern |
|
Site Forecasts |
Snapshot Date |
New column |
FacilityHistoricalForecast |
SnapshotDate |
|
Site Forecasts |
Status |
New column |
FacilityHistoricalForecast |
Status |
|
Site Forecasts |
Notes |
New column |
FacilityHistoricalForecast |
Notes |
|
Output Tables |
||||
|
Transportation Summary |
Solver Setting |
New column |
VehicleRouteOptimizationSummary |
SolverSetting |
|
Route Summary |
Out Of Route Cost |
New column |
VRPOutputRoutes |
OutOfRouteCost |
|
Route Summary |
Out Of Route Distance |
New column |
VRPOutputRoutes |
OutOfRouteDistance |
Supply Chain Home page
Data Management
Use Labels to Group Related Assets
You can assign labels to assets and create custom groups of assets based on those labels. The labels provide an additional search option and can also be used to perform "group by" operations.
Queue Management
View Detailed Logs of Macros Containing Child Macros
Macro logs now include detailed logs of any completed or running child macros, providing greater visibility into the macro's actual status. This eliminates the need for custom built solutions to monitor progress and access error logs in the event of failure.
View Logs of Custom Algorithms
A new Custom Algorithms tab allows you to quickly view the queue status of custom algorithms run in macros. Queue information available includes:
-
algorithm version
-
name of the algorithm
-
status of the execution
-
run date
-
user who submitted the custom algorithm
Stop a Running Macro
When a macro is running, click the Stop Macro button in the General tab of the macro's details to stop the macro. This is useful if you realize you want to make changes to a macro after you started it. Large macros can take a long time to execute, and you can save time by stopping it rather than letting it complete. Once stopped, you can make any necessary corrections and run it again.
Supply Chain API
New Insights Data Model endpoints SCDP 30.2
- GET /v3/insightsmodel
Returns a paged list of Insight Data Models.
- GET /v3/insightsmodel/{dataModelName}
Returns a specified Insight Data Model.
- GET /v3/insightsmodel/{dataModelName}/builds
Returns a list of build information for a specified Insight Data Model.
- POST /v3/insightsmodel/{dataModelName}/builds
Starts a build for the specified Insight Data Model.
- DELETE /v3/insightsmodel/{dataModelName}/builds
Stops a build for the specified Insight Data Model.
- GET /v3/insightsmodel/{dataModelName}/builds/logs/latest
Returns the latest build log for a specified Insight Data Model.
New Joule endpoints SCDP 30.2
- PUT /v3/joule/taskExecutions/{taskExecutionId}/cancel
Cancels an ongoing task execution, given the task execution ID.
- GET /v3/joule/taskDefinitions
Returns CPU and memory usage for a customer.
- POST /v3/joule/taskDefinitions
Creates a task definition with the given name and an optional description.
- POST /v3/joule/taskDefinitions/{taskDefinitionId}/versions
Creates a new version of a specified task definition.
- GET /v3/joule/taskDefinitions/{taskDefinitionId}
Returns a task defintion, given the task definition ID.
- DELETE /v3/joule/taskDefinitions/{taskDefinitionId}
Deletes a task definition, given the task definition ID.
- GET /v3/joule/taskDefinitions/{taskDefinitionId}/versions/{versionName}
Returns information about a task version of a task definition, given the task version and task definition IDs.
- DELETE /v3/joule/taskDefinitions/{taskDefinitionId}/versions/{versionName}
Deletes a task version of a task definition, given the task version and task definition IDs.
- GET /v3/joule/taskExecutions/substitution-environment-variables
Returns available environment variables that can be injected into the task execution container.
- GET /v3/joule/customers/{customerId}/taskExecutions/usage
Returns CPU and memory usage for a customer.
- GET /v3/joule/taskExecutions/{taskExecutionId}
Returns details of a task execution, given the task execution ID.
- GET /v3/joule/taskExecutions/{taskExecutionId}/events
Returns events of a task execution, given the task execution ID.
- GET /v3/joule/taskExecutions/{taskExecutionId}/logs
Returns paginated logs for a task execution, given the task execution ID.
- GET /v3/joule/taskExecutions/{taskExecutionId}/logs/file
Returns a log file for a task execution, given the task execution ID.
- POST /v3/joule/taskExecutions
Queues a task execution according to the restrictions imposed by the system.
- GET /v3/joule/taskExecutions
Returns a paginated list of the task executions that the caller can access.
- GET /v3/joule/customers/{createdByCustomerId}/taskExecutions
Returns a paginated list of task executions created by all users in a given customer.
- GET /v3/joule/users/{createdByUserId}/taskExecutions
Returns a paginated list of task executions created by a given customer.
- GET /v3/joule/taskDefinitions/{taskDefinitionId}/permissions
Returns information about permissions against the task defnition, given the task definition ID.
- PUT /v3/joule/taskDefinitions/{taskDefinitionId}/permissions
Updates a task permission.
Generate Supply Chain API keys
The Coupa Supply Chain API is a collection of public endpoints that provides access to resources and data in the Supply Chain cloud. Previously, access to the API was obtained by requesting an API key from customer support. With Supply Chain 30, you can generate an API key directly within the Supply Chain interface.
New endpoints
- GET v3/model/queue/{queueId}/status
Returns the status of a model queue execution, given the queue ID.
- GET v3/model/queue/{queueId}/logs
Returns a list of model logs that belong to a model queue, given the queue ID.
- GET v3/macro/execution/{executionId}/children
Returns a list of macro child executions that belong to a macro, given the execution ID.
- GET v3/macro/execution/{executionId}/logs
Returns a list of macro logs that belong to a macro, given the execution ID.
- DELETE v3/dataset/{datasetId}
Deletes a dataset, given the dataset ID.
- PUT v3/model/{modelId}/share
Shares a model with users or groups, given the model ID and a list of users or groups.
Last modified: Thursday April 17, 2025