Viewing how tables and connections are used by Data Flows actions
Many Data Flows actions use your connections' tables. The Table Summary feature lets you view how the tables and data connections are used by the actions. You access the Table Summary feature by selecting the Table Summary icon  on the canvas.
When a table or connection is selected in the Table Summary panel, color coded tabs are displayed on the actions. These tabs display how the table is used by the action.
-
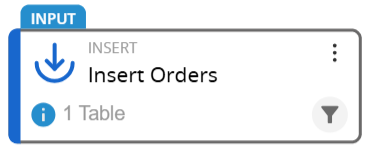
A blue Input tab indicates it is used as source data:
-
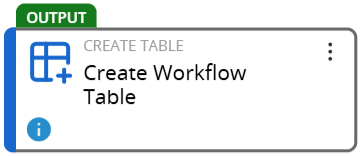
A green Output tab indicates data is written to a new table created by the action:
-
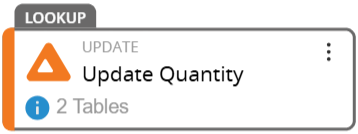
A gray Lookup tab indicates the table is used to find data from other tables:
-
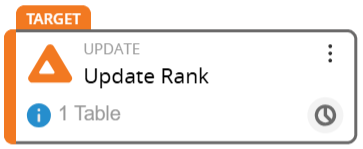
An orange Target tab indicates data is written to the existing table:
-
A red Delete tab indicates the table is deleted by the action:
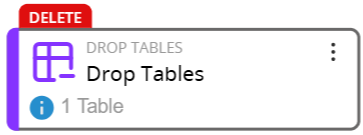
Multiple tabs are displayed if necessary.
To view how a table is used by a data flow
-
From the canvas, click the Table Summary icon
. The Table Summary panel appears. -
Select the table from the list of tables. The data flow actions that affect the table are marked with a tab according to how the action uses the table.
To view how a connection is used by a data flow
-
From the canvas, click the Table Summary icon
. The Table Summary panel appears. -
Select the connection. The data flow actions that affect the table are marked with a tab according to how the action uses the table.
Using the Table Summary panel
You access the Table Summary panel by selecting the Table Summary icon on the canvas. The panel displays a grid of affected tables and how they are affects, as well as a list of the databases use in the data flow. The tables are listed in alphabetical order. If there are tables with the same name from different connections, the duplicate names are alphabetized by the connection name.
The table grid has the following columns:
-
Table – the name of the table used in the data flow
-
Lookup – the number of actions that use the table as a lookup table
-
Input – the number of actions that use the table as an source table
-
Target – the number of actions that write data to the table
-
Output – the number of actions that write data to a new table
-
Delete – the number of actions that delete the table
Selecting a table will update the action tiles on the canvas to show which actions use the table in which capacity. Use Ctrl+Click to select multiple tables at a time.
At the bottom of the panel, there is a list of connections (databases, models, etc.) used in the data flow. Clicking on a connection updates the action tiles on the canvas to show how the actions use the connection's tables. Use Ctrl+Click to select multiple connections at a time.
Last modified: Wednesday February 05, 2025