Create a running cumulative percent of an entire table
The CumulativeSum function can be used to create a running cumulative percent for DCs of an entire table.
Step 1: Aggregate the order quantity to product and DC level
Create a dynamic view that aggregates the order quantity to a product and DC level.
-
Create a dynamic view to use for the aggregation. For this example, we use "0_RPOT_QuantPerProductLocation". The "0_RPOT" prefix is used to help keep views in order in lists and "RPOT" stands for Running Percent of Total.
- In the view properties, create a join between the source_location_dimension_Rkey field from the orders_full table to the location_dimension_Ckey field in the locations_dimension table.
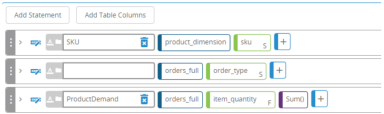
- In the dynamic view properties, add the following columns from the orders_full table:
- source_location_dimension_Rkey
- product_dimension_Rkey
- item_quantity
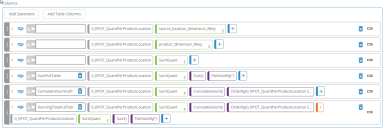
- For the item_quantity column, add the Sum function to aggregate the quantity. Name the column SumQuant. Your column specifications should now be similar to this:
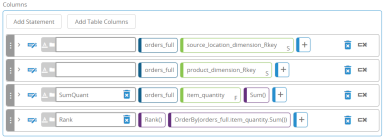
- Add a Rank statement to avoid the CumulativeSum behavior when there is a tie between rows. The CumulativeSum function groups members with the same value, which may cause the function to calculate values differently than expected when there are duplicate values. The CumulativeSum function is used in the next view. Order the rank by item_quantity. Your column specifications should be similar to this:
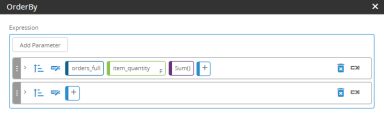
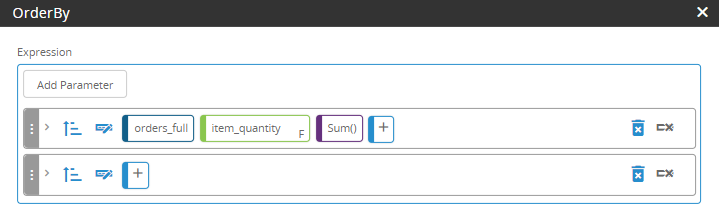
The OrderBy settings should be similar to this:
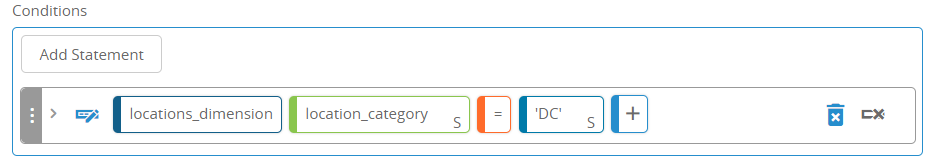
- Add a conditional statement to specify DCs. Your Conditions specification should be similar to this:

Step 2: Create a running cumulative percent of the entire table
Next, create a new dynamic view to include a running cumulative percent of the entire table without a partition by adding the following statements to the dynamic view, where "0_RPOT_QuantPerProductLocation" is the name of the dynamic view created in Step 1, and SumQuant is the column being summed in that view. The OrderBy function orders the results by the SumQuant column.
-
Create a new dynamic view to use for the running cumulative percentage. For this example, we use 0_RPOT_RunningPercentNoPartition. The "0_RPOT" prefix is used to help keep views in order in lists and "RPOT" stands for Running Percent of Total.
- In the dynamic view properties, add the following columns from the "0_RPOT_QuantPerProductLocation" dynamic view you created in Step 1:
- source_location_dimension_Rkey
- product_dimension_Rkey
- SumQuant
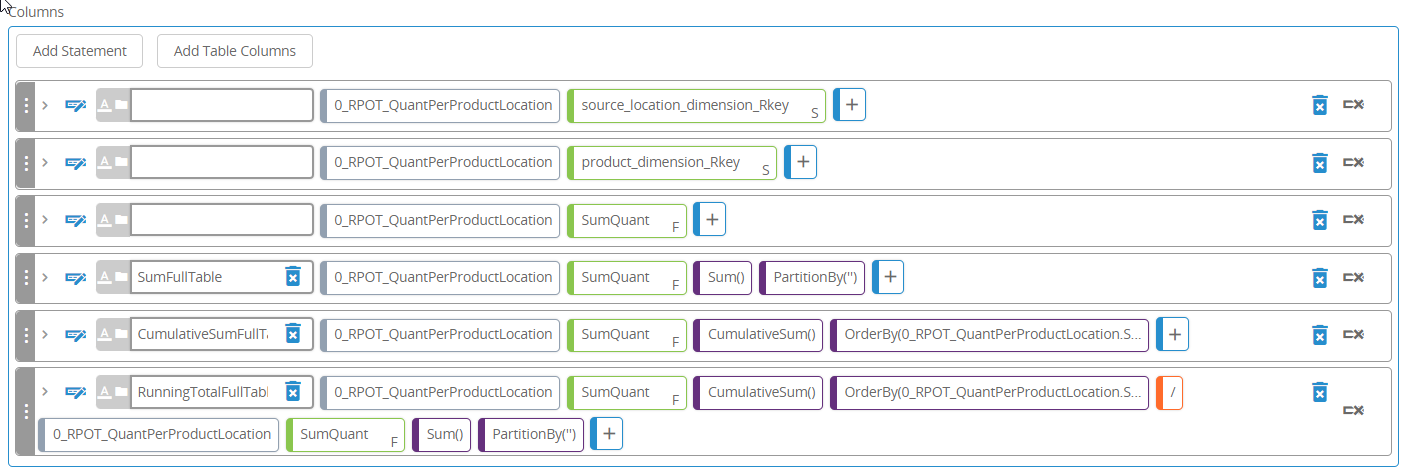
- Add this statement in the view's Columns section to aggregate the item_quantity for the table.
SumFullTable:[0_RPOT_QuantPerProductLocation].SumQuant.Sum().PartitionBy('') - Add this statement in the view's Columns section to create cumulative totals for the table.
CumulativeSumFullTable: [0_RPOT_QuantPerProductLocation].SumQuant.CumulativeSum().OrderBy([0_RPOT_QuantPerProductLocation].SumQuant) - Add this statement in the view's Columns section to calculate the running cumulative percent for the table.
RunningTotalFullTable: [0_RPOT_QuantPerProductLocation].SumQuant.CumulativeSum().OrderBy([0_RPOT_QuantPerProductLocation].SumQuant) / [0_RPOT_QuantPerProductLocation].SumQuant.Sum().PartitionBy('')The Columns section of the view should now look similar to this:
Last modified: Friday May 12, 2023