Cost to serve analysis
You can use cost to serve to review the landed cost of the overall flow of product from production to customer receipt for Network Optimization. Given a fixed network, cost to serve analysis enumerates paths and assigns the flow quantity of each path lane. All costs are assigned to each path and lane based on the flow quantity ratio. This allows you to understand which products and customers are most expensive in the network, in addition to the total landed cost. Use cases for cost to serve analysis include both strategic and tactical impacts such as:
- analysis of network cost
- SKU rationalization
- sourcing options
- new product introduction
- pricing options
You run Cost To Serve Analysis after Network Optimization is complete. When you run Cost To Serve Analysis, the Cost To Serve Details output table is populated with the lane by lane flow per Customer-Product-Period. The Cost To Serve Product Details table is populated with the flow quantity, production cost and inventory holding cost per Path-Site-Product. You can use the View Costs feature to display this information organized by flow from initial product to the customer.
Features of cost to serve analysis include:
- Efficient analysis results in good performance when dealing with large models.
- BOM relationship networks are built inside production sites, allowing component path and costs to be tracked accurately.
- More than 20 supply chain related costs are classified and assigned to each path and lane.
- Small loops are identified and reported in the Cost To Serve Network Loops table.
- In multi-period models, cross-period flows, inventory and production are considered. The results are provided in cross-period paths. For more information, see Multi-period cost to serve.
Cost to serve costs
The total costs for each lane are summed and reported as 19 individual cost fields. Each lane (leg of the flow) is then indexed with 1, 2, 3 and so on with 1 signifying the initial lane in the product flow to the customer. For each index, the source site, destination site, and product are noted. Costs are displayed for each lane in four aggregate buckets as summarized below.
- Duty Cost
- Intransit Inventory Holding Cost
- Transportation CO2 Cost
- Inbound Warehousing Cost
- Outbound Warehousing Cost
- Transportation Cost
- Sourcing Cost
- Fixed Startup Cost
- Fixed Operating Cost
- Closing Cost
- Capital Investment
- Facility CO2 Cost
- Work Resources Cost
- Demand Penalty
- Production Cost
- Facility Inventory Holding Cost
- Transportation Asset Cost
- Expression Based Cost
- Return Cost
- Carbon Offset Cost
- Tax Cost
- Production Costs with no outbound flows - For example, Site A makes 10 units of a product, but still has 10 units of that product in inventory at the end of the horizon. The production costs in this case are included in Other Cost .
Cost to serve revenue and profit rates
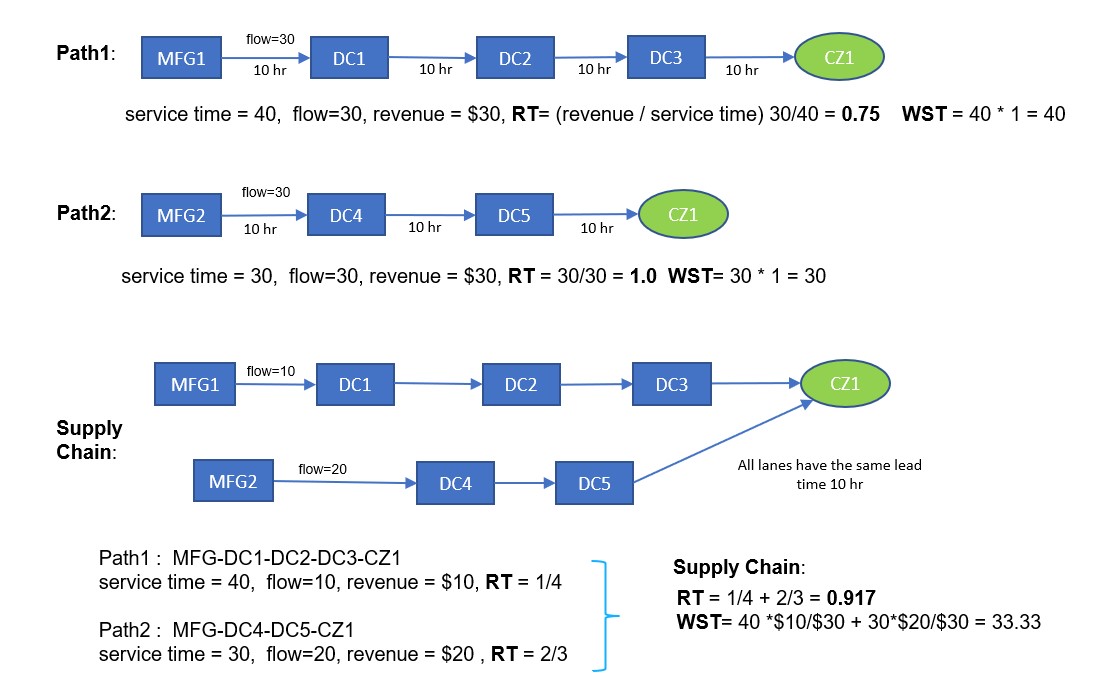
Cost to serve also reports revenue and profit rates with respect to service time incurred. These values are found in the Cost To Serve Network Summary and the Path Summary output tables. The image below provides an example of the revenue rate (RT) and the weighted service time (WST) used to calculate the rates at the path level and at the overall supply chain level.
Sites as path "customers"
In some cases, the Customer column in the Cost To Serve Details table can be populated with site names. If a site is displayed in the Customer column, this is an indication that this site had flow that never reached a customer. This can occur if flow ends up as inventory instead of being shipped to the customer. These types of paths are categorized as “Incomplete Paths” in the log file.
Current limitations of cost to serve analysis
The following are limitations in the current implementation of cost to serve analysis:
- The Cost To Serve fly out view does not currently directly support export to Excel. For additional analysis, the following workflows are supported:
This view is based on a model database object called “OptimizationOutputNetworkPathsDynamicView”. You can target this object directly in Tableau to provide additional analysis on the Cost To Serve output.
- When the view is open, press Ctrl+A to select all records, then use Ctrl+C to copy the contents to the clipboard. You can then paste the contents to an Excel worksheet.
Last modified: Wednesday May 15, 2024