Multi-period cost to serve
Prior to R34, cost to serve could not capture flows, inventory or production that spanned periods in a multi-period model. Cost to serve is now able to capture these as cross-period paths. Compared to earlier releases:
-
The number of paths in the solution may increase or decrease, as illustrated in the sections below.
-
The average path length (the number of sites a path visits) may increase. With cross-period functionality, paths now on average include more lanes.
-
Paths are more complete than in earlier releases. Previously, the path may have been broken into multiple, smaller paths because of cross-period flows, inventory or production. With the improved cross-period functionality, paths can now be defined from beginning to end.
In this example, the flow from MFG to DC is a cross-period flow; it starts in period 1 and ends in period 3. Production at MFG occurs in period 1. The flow from DC to CZ occurs in period 3:

Previously, the solution had 2 paths. One path had the production at MFG, the other had the lane from DC to CZ. The cross-period flow was not captured.
Cost to serve now creates a full path from MFG to CZ with the production and the two flows.
For large models with significant cross-period considerations, the run time may also increase.
Cross-period flows
Assume a case where 10 units of product P departs MFG in period 1 and arrives at CZ in period 3:

Previously, cost to serve could not capture this flow and didn't create a path from MFG to CZ.
Cost to serve now creates a lane for this flow in the Cost To Serve Details table. This behavior can increase the number of paths in the solution.
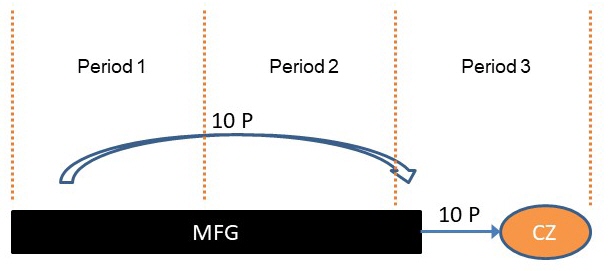
Cross-period inventory
Assume a case where 10 units of product P have been held at MFG since period 1. In period 3, the products leave MFG and arrive at CZ:
Previously, inventory was either at the beginning or end of the path. Cost to serve generated 3 paths: one for each period.
Cost to serve now creates one cross-period path in Cost To Serve Details from period 1 to period 3. The inventory can be in the middle of the cross-period path. This behavior can decrease the number of paths in the solution.
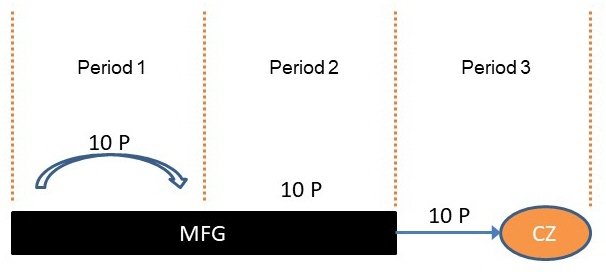
Cross-period production
Assume a case where MFG starts producing 10 units of product P in period 1 and finishes production in period 3. The products leave MFG in period 3 and arrive at CZ:
Previously, cost to serve generated one path in period 3, assigning production to the end of the path.
Cost to serve now creates one cross-period path in Cost To Serve Details where production starts in period 1 and ends in period 3.
Last modified: Wednesday May 15, 2024