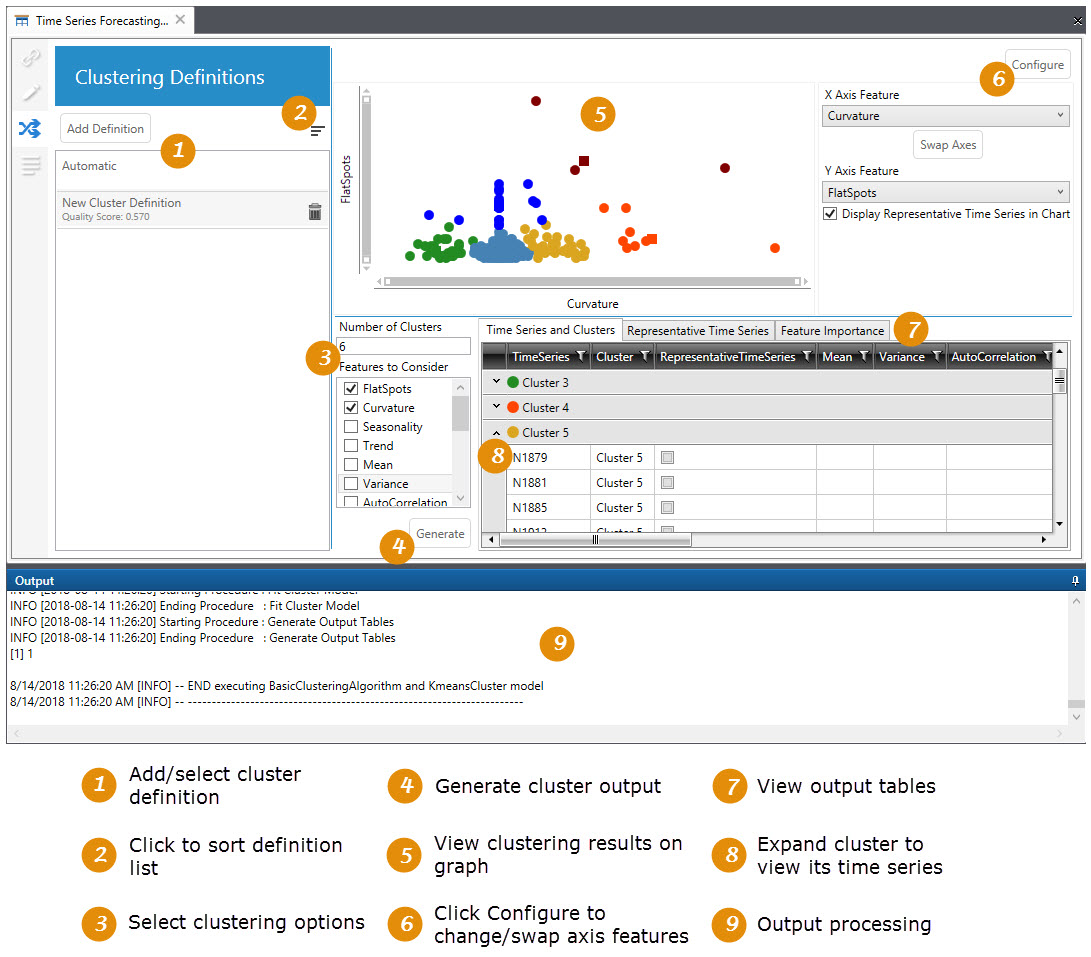
Configuring time series clusters
Once you have generated your time series, use the Clustering tab on the workbench to configure cluster definitions that group those time series based on a set of available attributes. You can customize copies of the default cluster definition generated when the time series are generated, or you can create new clusters. You must select Generate Time Series Only on the Definition tab of the workbench before you can configure clusters. Clustering can be performed with a minimum of 6 non-intermittent time series that each contain more than 10 data points.
Clusters you define on this tab are saved when you save the workbench.
Clustering Definitions
By default, the Clustering Definitions pane includes an Automatic Cluster Definition created from the time series generation. This definition cannot be edited, renamed, or deleted. A Sort icon ![]() allows you to sort by:
allows you to sort by:
- Date Created
- Alphabetically
- Date Clusters Last Generated
Data Visualization
Similar to the Demand Modeling tab of the workbench, this area includes several components:
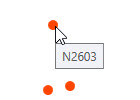
- Graph display of cluster data, with the time series for each cluster represented by a different color. The X and Y axes represent the two features determined by the algorithm to be most important (if more than two features have been selected). You can hover over any data point to display the name of the associated time series.
- Configure button, which allows you to manipulate the features used to display the graph and display or hide the representative time series in each cluster.
Cluster options
This area allows you to define the number of clusters and features to be considered. Note that this area is disabled for Automatic clusters.
- Number of Clusters - Enter the number of clusters into which the time series will be grouped. You can enter a value between 2-100, or you can accept the default value of auto and allow the application to determine an optimal number of clusters between 2-20, in the same manner as when selecting the Automatic cluster definition. If clusters are generated using auto, the number of clusters actually generated is displayed in this field.When using the auto default, no changes are made to your Features to Consider selections. Seasonality and Trend are still selected by default, but you can override the defaults and make your own selections.
- Features to Consider - Use the checkboxes to select the features to be included when running the algorithm. When the cluster output is generated, the selected features appear at the top of the list in their order of importance. At least two features must be selected.
- Generate - Runs the algorithm and creates clusters based on the cluster options selected
Output tables
Three tables are generated:
As with other tables in Demand Guru, you can sort by specific columns or use the filter icon available in each column header to limit the display of rows based on selected criteria.
Output processing
This area displays the processing steps completed during execution of the clustering algorithm.
Last modified: Thursday December 19, 2024