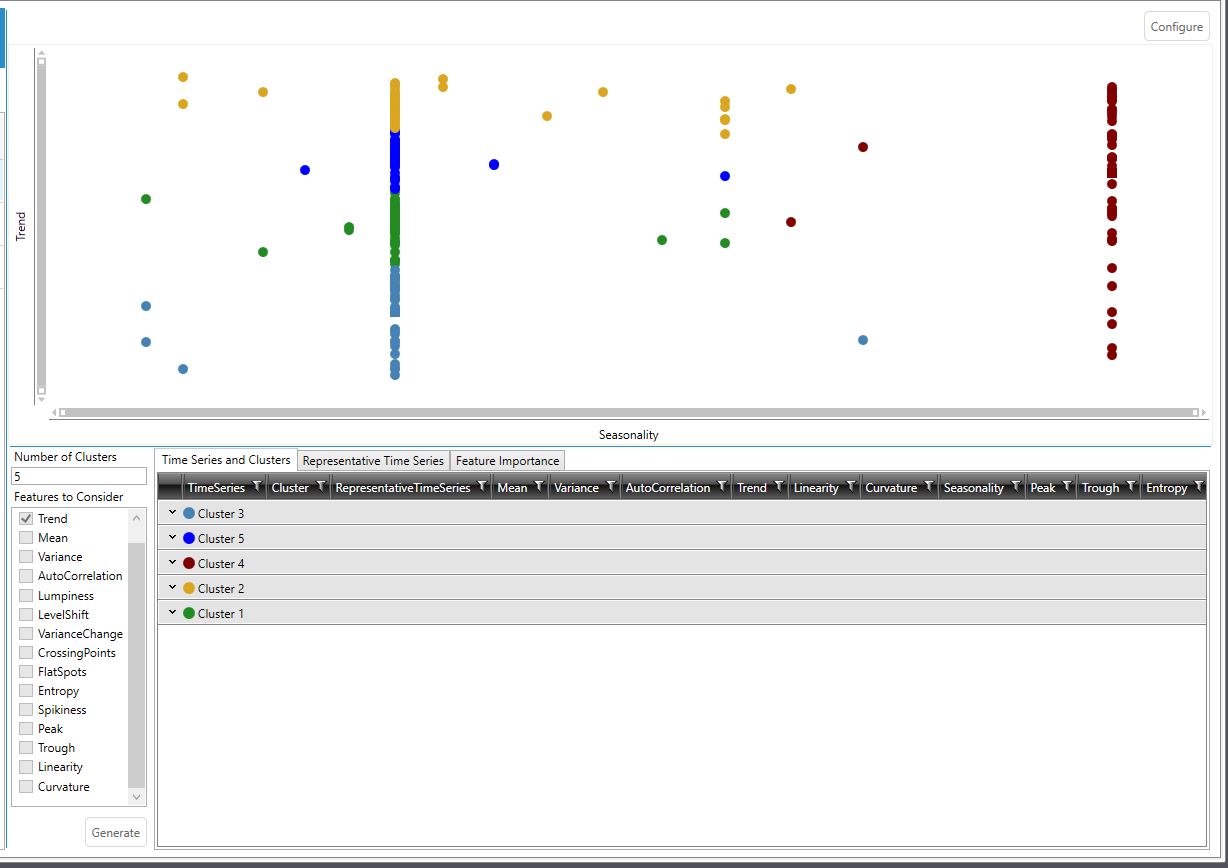
Demand clustering output
This table lists the clusters formed after execution of the cluster model, and displays information about the time series grouped into these clusters, including the score assessed by the clustering algorithm for each feature.
- For time series that belong to the Intermittent / Extremely Slow/ Unclassified demand category, none of these features are extracted, and the feature scores are listed as NULL values in the table.
- Time series that do not fit into any cluster, such as those for which a feature score cannot be assessed, are identified as Unclustered.
The color swatches before the cluster names match the colors shown in the feature plot graph above the output tables:
In the expanded view, all time series belonging to a cluster are displayed, with each column representing unique information about that particular time series:
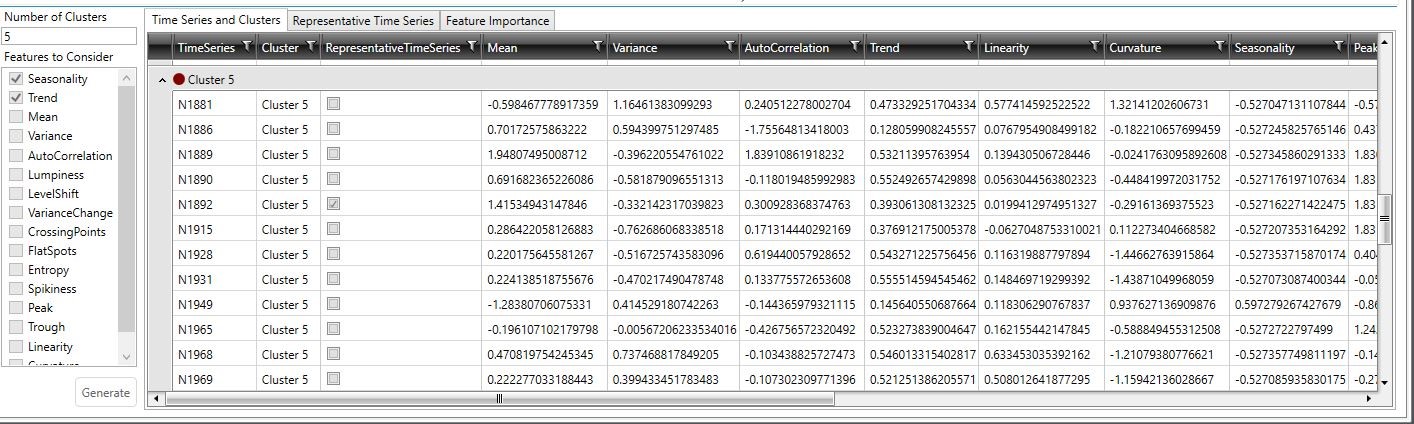
The user-specified name of each time series; for example, SKU identifiers, customer identifiers, or any of the "Group by" tags used in the data being clustered.
The cluster to which each time series belongs after execution of the cluster model. The number of different clusters reflected in this column is based on the value entered in the Number Of Clusters field; however, the number of different clusters shown for the Automatic cluster definition is based on those chosen by the algorithm.
Any user-specified time series with an Intermittent or Extremely Slow or Unclassified demand classification is excluded from further partitioning within the cluster model and classified under a cluster labeled Intermittent. This cluster is in addition to the standard clusters formed by the algorithm.
Any time series that cannot fit into a cluster is labeled as Unclustered. As with the Intermittent cluster, this designation is not included in the number of clusters created.
Indicates whether a time series is representative of the cluster under which it is classified.
In the K-Means Cluster algorithm that drives the Automatic cluster model and the User-defined Cluster model, the average value of feature scores for various time series classified under a cluster are output as their centers.
However, the average of feature scores is usually not a time series that is input by the user. For example, if θ = {2,3}, Average(θ) = 2.5, but that value is not present in θ, then interpreting the defining characteristic of that cluster becomes an arduous task.
To achieve a seamless transition of integrating cluster definitions with modeling, the time series that is closest to each cluster center (the time series that has the smallest Euclidean distance from the center) is defined as the representative time series. For the Intermittent cluster, no representatives are identified because they are excluded from any further clustering workflow that happens in Demand Guru. Likewise, time series identified as Unclustered do not feature a representative time series.
In determining the representative time series, some time series may have trailing zeroes removed to improve accuracy of the calculated features, and to enable formation of better clusters (for example, the product may have been withdrawn from the market two years ago). In these instances, classifying such time series as representative negatively impacts the association of demand models that can work across a variety of other time series. Therefore, priority is given to time series that extend to the most recent horizon over time series that have had trailing zeroes removed, even though they may have the closest feature distance from the cluster center.
Feature scores
The remaining columns display the scores assessed for each feature.
This table contains the same columns as the Time Series and Clusters table; however, only the time series that are identified as representatives of a cluster are listed, along with their feature scores.
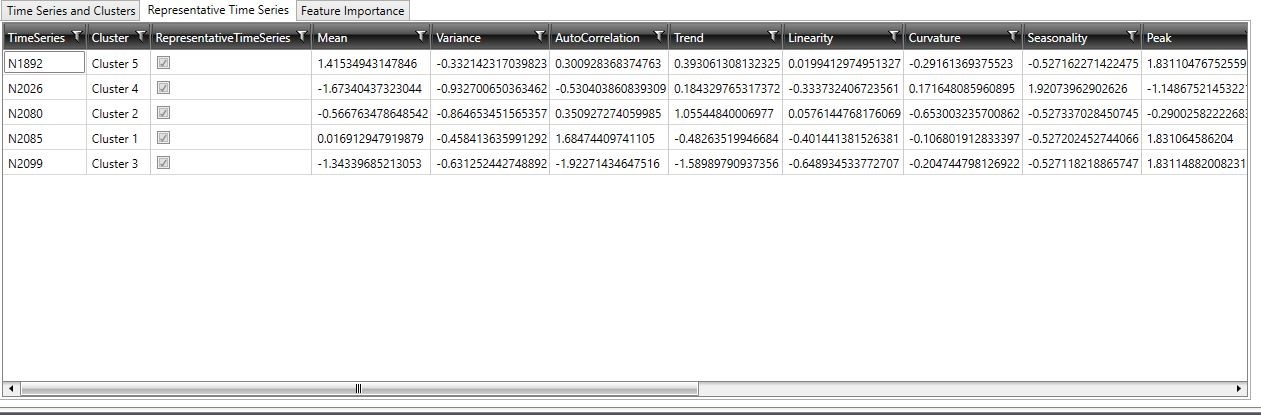
The name of the representative time series.
The cluster represented by the time series. The number of different clusters represented in this column is based on the value entered in the Number Of Clusters field; however, the number of different clusters represented for the Automatic cluster definition is automatically based on those chosen by the algorithm.
Indicates that the time series is representative of the cluster in which it is classified, meaning that it is the time series that is closest to the cluster center (the time series with the smallest Euclidean distance from the center).
Feature scores
The remaining columns display the scores assessed for each feature.
- Seasonality
- Trend
- Mean
- Variance
- Auto Correlation
- Lumpiness
- Level Shift
- Variance Change
- Crossing Points
- Linearity
- Curvature
- Peak
- Trough
- Entropy
- Spikiness
- Flat Spots
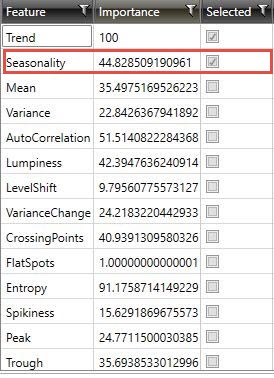
This table provides information on the features that were considered for clustering, along with a tabulation of their relative importance scores:
The names of the features considered for clustering. In the Automatic cluster model, all features are extracted by default; therefore, all 16 features are visible under this column. In the User Defined K-Means cluster model, only those you selected as input are visible.
Since clustering falls under a class of machine learning called “Unsupervised Learning”, determining the best model with the right combination of features and an appropriate number of clusters is computationally infeasible. Therefore, Demand Guru estimates the relative individual importance of each feature as a substitute for its importance in the overall clustering model, assigning a score to each feature.
To determine the score for a feature, calculations on the feature are performed based on a varying number of clusters (4 - max number of clusters), and then an average taken.
These importance scores are used to determine which features should be utilized in the final clustering model and should not be construed as its contribution in the final clustering model. Feature importance is scaled between 1-100: a higher score indicates that the feature by itself can form well-defined partitions, while a lower score indicates that the feature may not be important enough by itself to form well-defined clusters.
Indicates if a feature was chosen as a part of the final clustering model.
- User-defined clustering models - because all features selected are forced into the final model, all selected features are checked.
- Automatic cluster model - only those features chosen by the algorithm are checked.
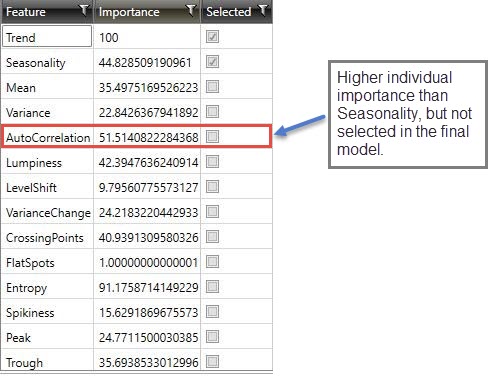
In the following example of an Automatic clustering model, Trend and Seasonality are the selected features, and Trend is the most important feature on its own relative to the others. AutoCorrelation, despite having an individual importance higher than Seasonality, is not selected in the final model - indicating that the combination of the best feature (Trend) with Seasonality (3rd best feature on its own) provides better clustering results than with any AutoCorrelation (2nd best feature).
Last modified: Thursday December 19, 2024