R scripting
The R Scripting ![]() action allows you to transfer data to the R environment, run analytical scripts using the data, produce a report in HTML, and populate an existing table with output data from the analysis.
action allows you to transfer data to the R environment, run analytical scripts using the data, produce a report in HTML, and populate an existing table with output data from the analysis.
- Input tables are available as data frames in the R environment.
- Output tables must be defined in the R script as data frames with a matching schema; i.e., the Data Frame column names must match the column names of the output table.
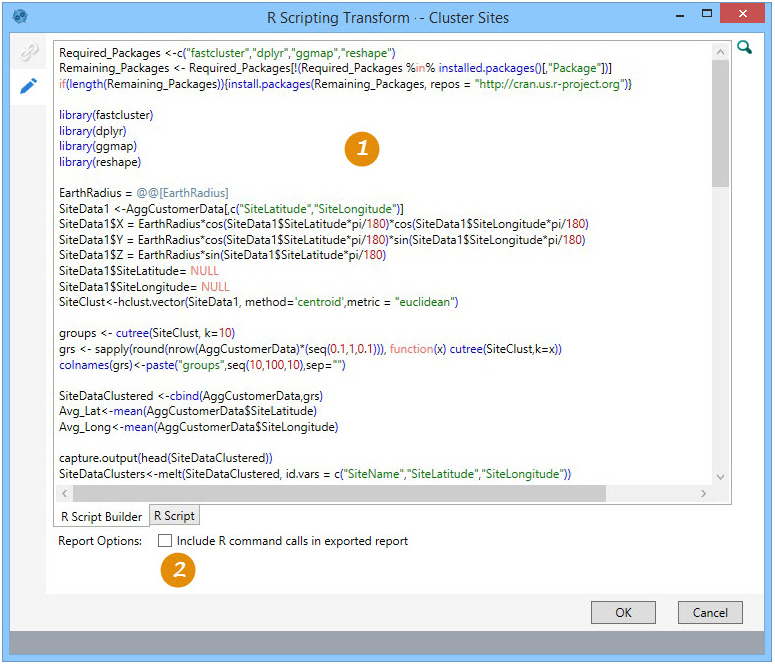
On the Configuration tab:
-
Define the R Script with parameters.
-
Use the Report Options to include R command calls in the exported report.
Possible applications include:
- Generate descriptive statistics about the dataset
- Investigate correlations between variables
- Generate Predictive Analytics models
This action is not supported in the Supply Chain platform.
Run native R script
- Drag the R Scripting icon onto the design surface.
-
On the Connections tab
 , enter a Name and a Description to identify this action, then specify the database and table:
Input Tables -
- For Database Connection, select the database containing one or more tables on which the R Script is to be executed, or choose New Database Connection to establish a new connection.
- For Table Name, select one or more tables containing the input data. To remove a table from the list of selected tables, highlight the table name, and click the Remove icon
 .
.
Output Tables -
- For Database Connection, select the database of the output table(s).
- For Data Frame Name, use the drop-down to select one or more tables for the R Script results. To remove a table from the list of selected tables, highlight the table name, and click the Remove icon
 .
.
- On the Configuration tab
 :
: - Use the R Script Builder to create the R code. You can copy and paste code from another source, or you can type the code directly in the work area of the builder.
- To add a parameter you have already created, add a left bracket character, and begin typing it in the builder, then select it when it is identified.
- To view the actual R code created with the builder, click on the R Script tab at the bottom of the action’s window.
- Use the checkbox in Report Options to generate a HTML report of the interaction of Data Guru with R. The contents of the report are determined by the Change tool preferences setting in Changing user preferences.

Last modified: Thursday December 19, 2024