Pivoting numeric data in a table
The Pivot Table ![]() action allows you to create a summary version of numeric data in a table and save that version to another table. You can:
action allows you to create a summary version of numeric data in a table and save that version to another table. You can:
- Aggregate data using a variety of functions
- Filter the input records
-
Capture the output schema of the output table(s)
When the action is executed, the contents of the resulting columns are also reflected in the column names.
-
Use to separate values for multiple column selections.
-
Use to indicate types of total values to be included.
-
Define filters to limit aggregated records.
-
Define one or more fields to be represented as rows.
-
Define one or more fields to be represented as columns.
-
Set properties of each field being aggregated.
-
Define filter to limit aggregation results.
-
Click to capture schema.
-
Preview data or SQL results.
Possible applications include:
- View quantity totals, such as shipment or order data.
- Transform data in flat file format for use by an analytical algorithm.
Pivot a table
- Drag the Pivot Table icon onto the design surface.
-
On the Connections tab
 , enter a Name and a Description to identify the action, then specify the input and output data source options.
Input -
- For Database Connection, select the database containing the table to be summarized, or choose New Database Connection to establish a new connection to another database.
- Table Name – Use the drop-down to select the table that contains the data to be summarized.
Output -
For this action, the Database Connection defaults to the same database as the input connection and cannot be changed.
- Enter or select a Table Name for the pivot table.
- Use Create Column Alias Table to create a separate table that uses a default column name when the name length exceeds the database limit as a result of the pivot. By default, the output file name is prefixed with the Table Name entry, followed by _columnaliases. Note that this name does not change automatically if the Table Name entry is subsequently changed; it must be changed manually.
- Use Create Totals Output Table to create a separate table for subtotals and grand totals of row and column data. By default, the output file name is prefixed with the Table Name entry, followed by _totals. Note that this name does not change automatically if the Table Name entry is subsequently changed; it must be changed manually.
- Optionally, choose the Output Mode options to be used when creating or overwriting the output table(s). Note that these options affect all output tables for this action -
- Add a new _autokey field to the table(s), with incremented values that make each table row unique. This is required by some database types.
- Indicate that the table(s) should be deleted after the macro or workflow has executed.
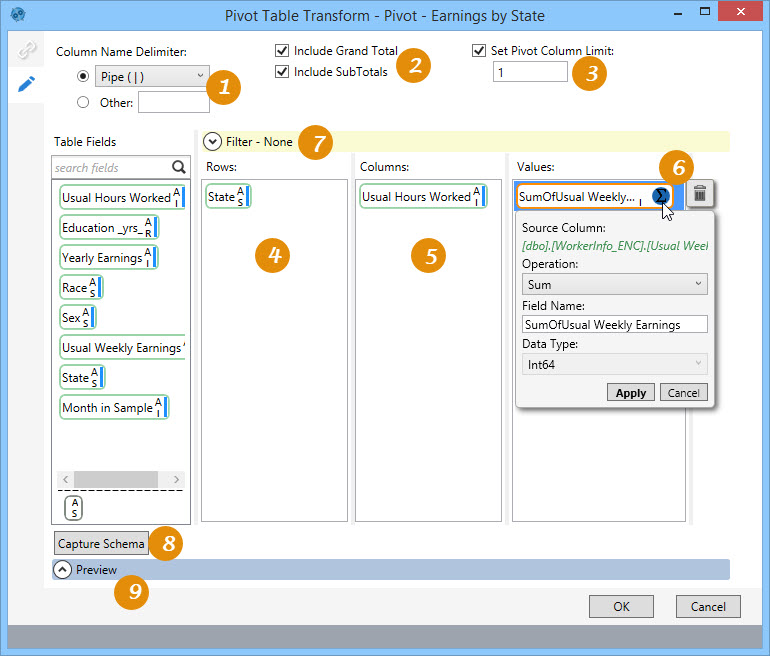
- On the Configuration tab
 :
: - Select a Column Name Delimiter to separate values for multiple column selections; for example, separating product and color using a pipe (|) results in ProdA|Black. Alternatively, select Other and type a different delimiter to be used.
- Select Include Grand Total to include total values for each column, and select Include Subtotals to include subtotal values for each aggregated group.
- In Set Pivot Column Limit, indicate the maximum number of columns to display per the aggregation value specified in the Values section).
- For Rows and Columns, drag one or more icons from Table Fields to indicate the fields to be represented as rows and columns. When you include more than one field as a row or column, the order of the icons determines how the data is grouped and/or aggregated in the resulting display.
- For Values, drag the field(s) with values to be aggregated. As with Rows and Columns, if multiple fields are being aggregated, their order in the Values column determines the aggregation hierarchy.
- Click on each aggregation field to define its properties:
- Operation – Select the type of operation being performed on the data.
For numeric fields -
- AVG - Returns the average of the values in a group. Null values are ignored.
- CNT - Returns the number of items in a group.
- CNT D - Returns the number of distinct items in a group.
- MAX - Returns the maximum value in the expression.
- MIN - Returns the minimum value in the expression.
- STDEV - Returns the statistical standard deviation of all values in the specified expression.
- SUM - Returns the sum of all the values, or only the DISTINCT values, in the expression. SUM can be used with numeric columns only.
- VAR - Returns the statistical variance of all values in the specified expression.
For string fields -
- CNT - Returns the number of items in a group.
- CNT D - Returns the number of distinct items in a group.
- MAX - Returns the maximum value in the expression.
- MIN - Returns the minimum value in the expression.
- CON - Returns a string with concatenated non-NULL values from a group, separated by a comma.
- Field Name – Enter the name for the aggregated field.
- Data Type – Indicate the type of data being aggregated.
- Operation – Select the type of operation being performed on the data.
- To more narrowly define the conditions by which the action is executed, open the Filter area and build the necessary expression using choices from the Table Fields area or by using the Expression Editor.
- Use Capture Schema to capture the data schema based on your configuration selections. Note that the schema is also captured whenever you preview or refresh the data.
- Click Preview to view the data or the SQL statement created from this action. Refer to Preview for information.
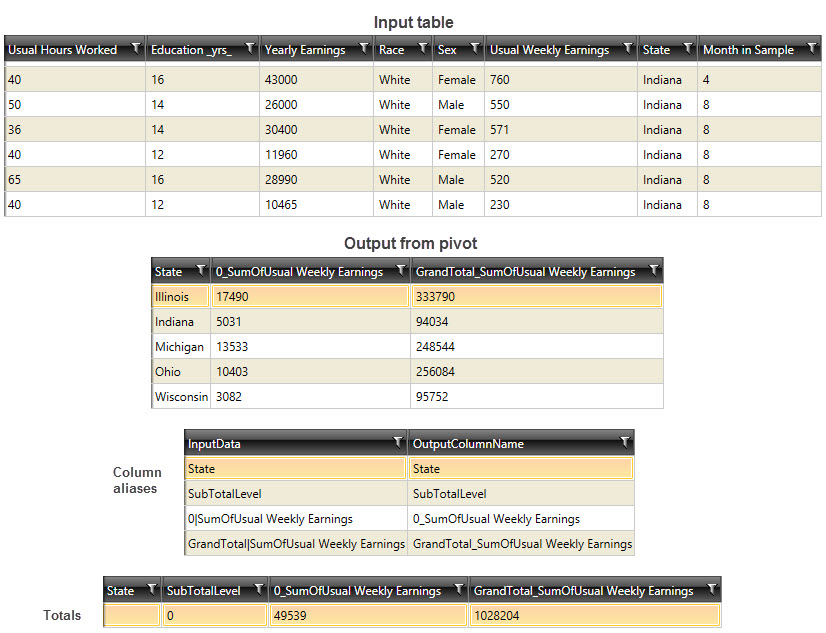
Pivot Table data example
The following example shows an input table containing numeric data, and the resulting output tables:
Last modified: Thursday December 19, 2024