Inventory Simulation workflow
A flow chart for Inventory Simulation is show below:

Note that when using Inventory Simulation, there are two different paths you can take:
- Generate demand series – As highlighted in the orange box.
- Use historical demand – As highlighted in the grey box.
In principle, you should run simulation for a model period with a long demand series. By default, Inventory Simulation generates a 2-year long demand series with a 3 month warm-up period. You can adjust both the simulation length and the warm-up period as needed.
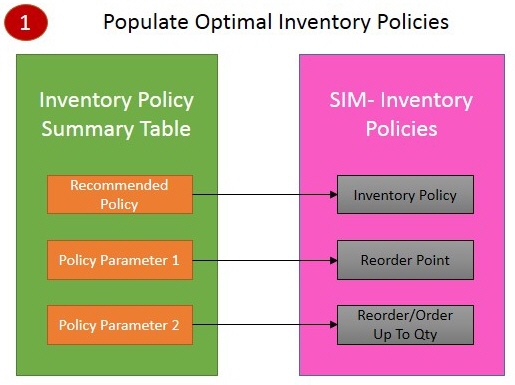
As described earlier, the inputs for Simulation are populated using the Safety Stock Optimization results for a given site-product combination. The mapping of these results follows a number of steps. First, the optimal inventory policies are populated, as shown in the graphic below:
The next step is to determine the initial inventory levels. The initialization of the on-hand inventory represents a system that begins as if the inventory system has just received replenishment. The policy is initialized at a very high customer service level (99.9%) in order to minimize the risk of a backlog at the beginning of the replication. The simulation is started such that the inventory on hand at the beginning of the run (the Initial Inventory level) is equal to the order up to level as shown in the graphic below:

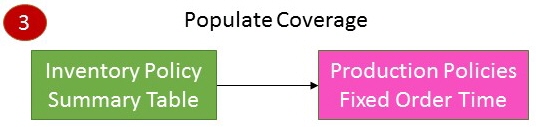
Next, the optimal coverage values are mapped into lead times. A common method to create a single echelon model is to assume that the site is a production unit. Then, the lead time of the production site is regarded as a production time. The optimal coverage values are mapped to the production time, as shown in the following graphic:
Last modified: Wednesday May 15, 2024