Demand Analysis
Safety Stock Optimization determines how much inventory must be held to ensure against demand and lead-time variability. The goal of Demand Analysis is to end up with a profile of the demand variability throughout the network, a classification for the demand, and other advanced statistics used to understand the demand. This is required in order to calculate safety stock, because without knowing the demand variability, it is impossible to calculate how much to hold in safety stock. To learn more, refer to:
- Demand Analysis inputs
- Demand propagation
- Outlier analysis
- User Defined Forecast Profile
- Demand Analysis outputs
- Demand classification
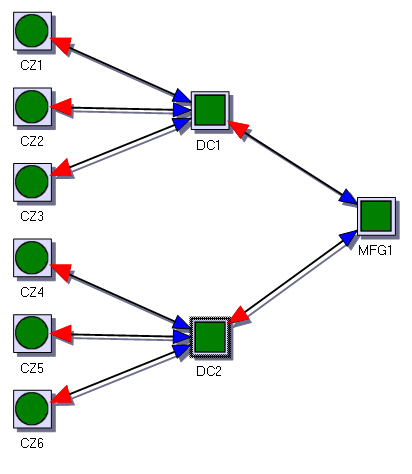
The amount of inventory required at each site is ultimately dictated by customer demand. The required level of inventory for each site is determined by observing customer demand, as well as how the demand traces up the network chain from the customer to the manufacturing plants. The customer demand requirements are propagated through the multi-echelon network. An example of a network structure is shown below:
Based on the demand of each customer, a customer demand profile is created.
A demand profile is created for facilities based on the cumulative orders (the aggregated demand) that arrive at a site. Because the site’s demand is an aggregate of many demand flows from different customers, the means and the variations of the flows are combined and the risk pooling effect comes into play.
The greater the number of demand flows for a product that flows into a site, the higher the risk pooling effect; moreover, the higher the risk pooling effect, the lower the relative safety stock inventory levels.
Demand Analysis provides options for controlling the size of the time buckets used to aggregate demand. For example, you can specify weekly or monthly buckets, rather than daily buckets.
|
Watch this video to learn how to run Demand Analysis and analyze the results. Right-click on the video and select "Open video in new tab" for a larger display: |
|
Use of Demand Analysis
Demand Analysis aggregates demand, performs analysis of any outlying demand and generates a set of statistics that are used to classify the demand. Using these statistics and user-definable threshold values, Demand Analysis is able to segment the demand into a set of classifications. Demand classification distinguishes between the different types of demand for each product at each site in a multi-echelon model. This information is provided in demand profile tables. Once Demand Analysis is complete, if the Safety Stock Rule is set to "Multi-Echelon", Safety Stock Optimization solves the multi-echelon inventory to optimality. It determines the service times and coverage values for each site-product combination. Based on these coverage values, sites may or may not require safety stock. For those requiring safety stock (that is, a positive coverage value), Safety Stock Optimization calculates the required safety stock based on the demand class, demand statistics and lead-time demand distribution.
Demand Analysis example
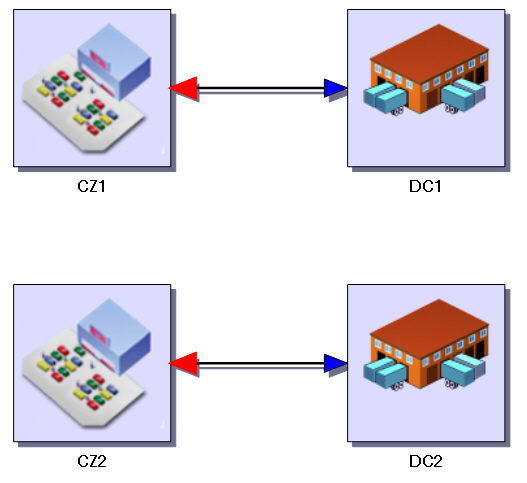
Consider a basic model with 1 product, 2 customers (CZ1, CZ2), and 2 distribution centers (DC1, DC2).
Both customers have a normally distributed demand with a mean and standard deviation of 100 (only the standard deviation is a component of the safety stock calculations).
In one scenario, both distribution centers serve a separate customer, and both use a standard deviation of 100 as a component in the safety stock calculations.
In another scenario, where 1 distribution center serves both customers, the standard deviation is pooled. Instead of having two distribution centers that encounter a demand variation of 100 each, there is now 1 distribution center encountering a demand variation of 141. Given all other components that go into the safety stock calculation stay the same, the overall safety stock levels are reduced.
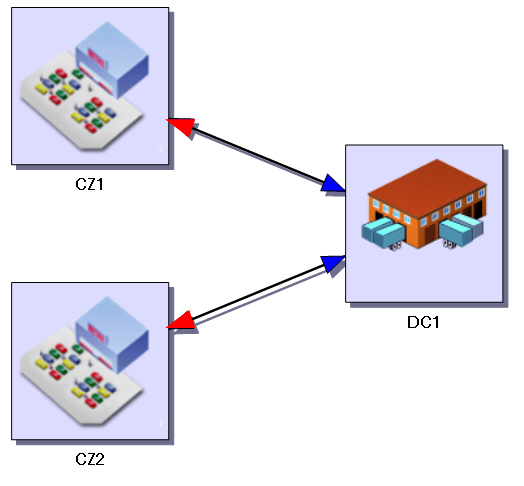
As this example demonstrates, as a site serves more sites, the risk pooling effect is increased, and the overall safety stock level is decreased.
For this same reason, the manufacturing plants generally serve a greater number of customers and have a higher aggregation of demand placed on it than distribution centers. Manufacturing plants are therefore more resilient to fluctuations in demand.
Demand Analysis process
Demand Analysis performs the following high level functions:
| Demand Characterization | Aggregates demand to a specified bucket – day, week or month. Supports 5-day and 7-day work weeks that let you exclude weekends from demand aggregation. |
| Propagates customer demand to all the nodes in the supply chain. | |
| Summarizes demand transactions into a detailed set of statistics. | |
| Identifies outliers at customers and customer-facing facilities. Outliers can be ignored or replaced with an average demand size. Demand is adjusted for use in analysis. | |
| Demand Classification | Classifies demand by site-product-period based on the calculated statistics. Classification is based on threshold values that are user-definable. |
Outlier analysis
Demand Analysis always identifies outliers using thresholds based on the Non-Zero Demand Std Dev and Non-Zero Demand Mean values. It performs outlier analysis in multiple iterations, one outlier at a time.
- Non-Zero Demand Std Dev – This is used to trigger outlier analysis. If the Non-Zero Demand Std Dev is less than 10, Demand Analysis skips the next outlier detecting process, and continues to demand classification.
- Non-Zero Demand Mean – If the Non-Zero Demand Std Dev is greater than or equal to 10, outlier detection starts. Demand Analysis looks at the aggregation level with the largest demand size (Dmax) and compares that with 10 * Non-Zero Demand Mean from the rest of the demand. Dmax is determined as an outlier only when it is larger than or equal to 10 * Non-Zero Demand Mean from the rest of demand smaller than Dmax. The outlier handling option then determines what to do with the outlier. Demand Analysis recalculates the Non-Zero Demand Std Dev and returns to step 1 to process the next possible outlier.
Based on the user setting for handling outliers, Demand Analysis will do one of the following:
- Do nothing – Outliers are detected, but still included in demand statistics.
- Replace with Non-Zero Demand Mean – Demand Analysis replaces outliers with the demand mean that is determined using the rest of the demand smaller than the outlier, and uses the adjusted demand in the analysis.
Last modified: Wednesday May 15, 2024