Demand classification
Demand Analysis classifies demand at all site/customer-product-period combinations. The demand classification flow is illustrated in the following diagram:
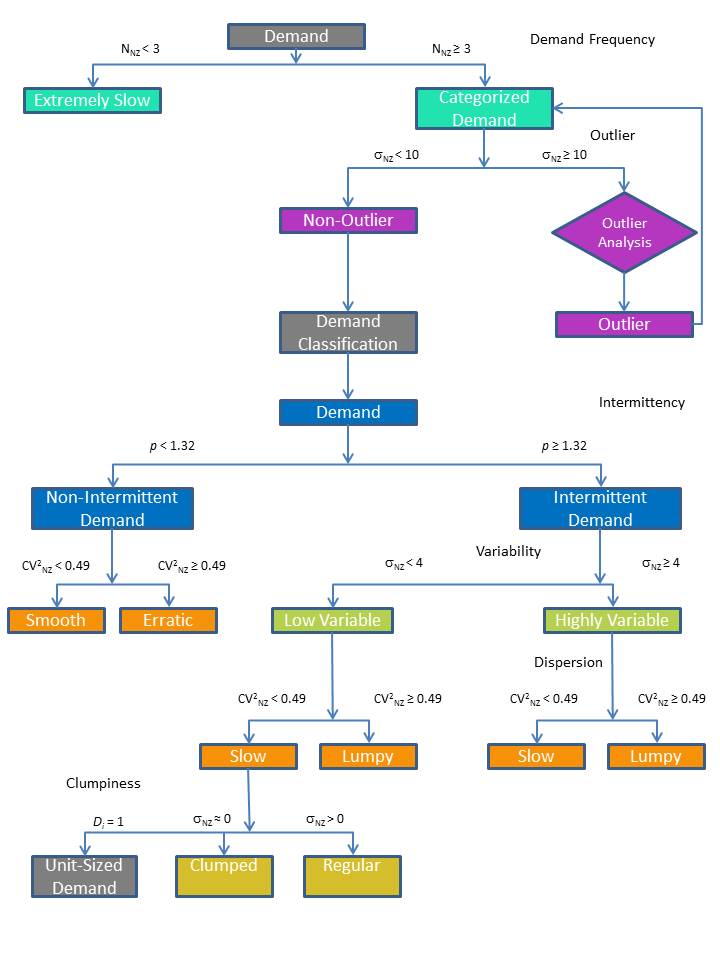
The values used for demand classification are defined in the following table:
| Parameter | Description | Column in demand profile table |
| NNZ | Non-zero demand count | Demand Count |
| p | Mean demand intervals | Inter-Demand Interval Mean |
| µNZ | Non-zero demand mean | Non-zero Demand Mean |
| σNZ | Non-zero demand standard deviation | Non-zero Demand Std Dev |
| CV2NZ | Squared coefficient of variation of non-zero demand. This is the variability in relation to the mean. | Non-Zero Demand CV2 |
| Di | Aggregated demand size | |
| Dmax | Demand with the largest size | Max Non-zero Demand |
Class descriptions
Demand classification identifies demand as one of the following classes:
- Extremely Slow
- Extremely Variable
- Extremely Small
- Non-Intermittent – Classes are:
- Smooth
- Erratic
- Intermittent – Classes are:
- Low Variable
- Slow
- Lumpy
- High Variable
- Slow
- Lumpy
- Low Variable
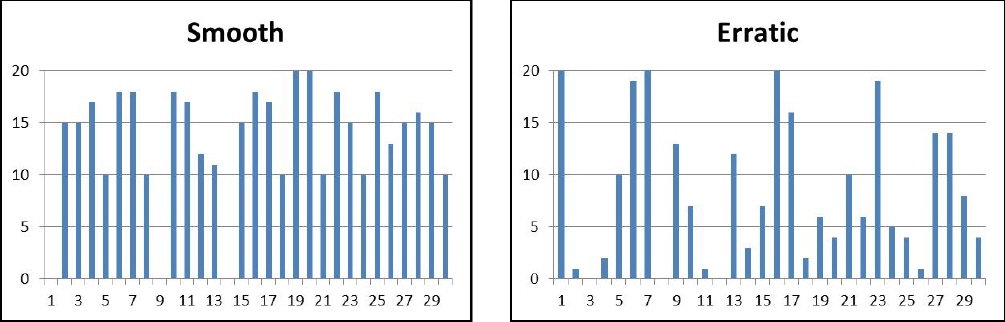
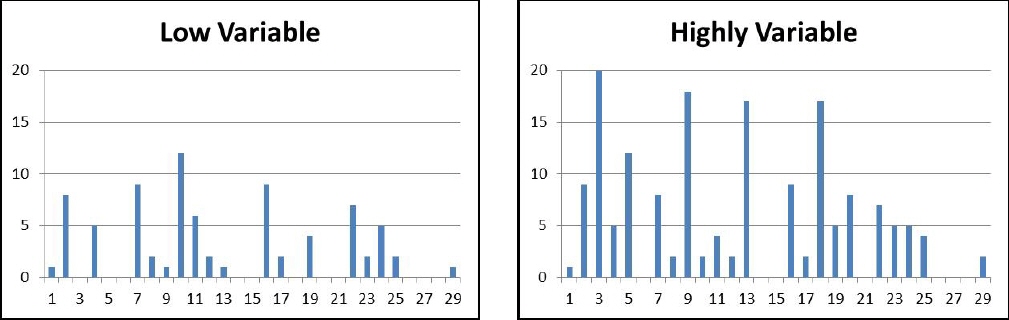
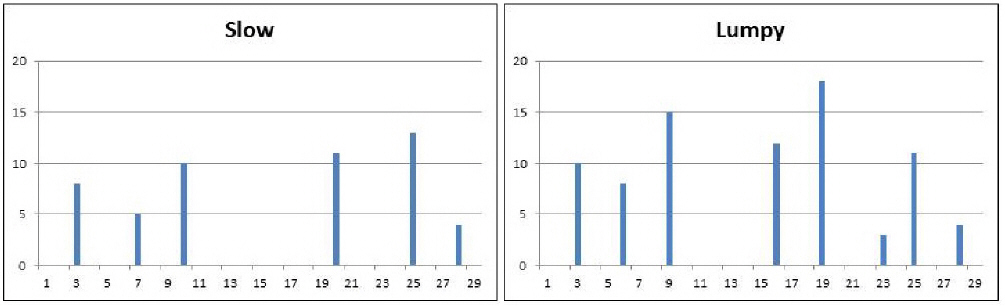
In many cases, it is easiest to understand the classifications by comparing one to another, as shown in the following graphs.
Extremely Slow
Extremely slow demand occurs when the demand count is very low (by default, fewer than 3) over the period (or model horizon in a single period model) as shown below:
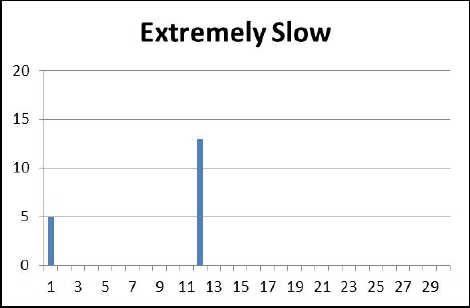
This demand will have a large Inter-Demand Interval Mean. In this case, no inventory policy or associated parameters are recommended.
Extremely variable
Extremely variable demand occurs when the coefficient of variability (COV) is greater than or equal to 5. This is determined as demand std dev / demand mean. This demand is highly variable and Safety Stock Optimization may recommend holding significant safety stock. An inventory policy and parameters are returned.
Extremely small
Extremely small demand occurs when the Non-Zero Demand Mean is less than 1. In this case, no inventory policy or associated parameters are recommended.
Non-intermittent – smooth vs. erratic
With non-intermittent demand, the Inter-Demand Interval Mean is small, meaning that demand occurs regularly with few exceptions in the period (or model horizon in a single period model). This demand is further classified as either smooth or erratic based on relative variability, with smooth having a lower value for Non-Zero Demand CV2 than erratic:
Intermittent – low vs. highly variable
With intermittent demand, the Inter-Demand Interval Mean is greater than for non-intermittent demand. This means that there is irregularity in when demand occurs over the period (or model horizon in a single period model). Intermittent demand is considered to be either low variable or highly variable. Low variable demand has a lower Non-zero Demand Std Dev than highly variable demand:
Intermittent – slow vs. lumpy
Intermittent demand is further classified as either slow or lumpy based on relative variability, with slow having a lower value for Non-Zero Demand CV2 than lumpy:
Class mapping
The table below shows the mapping between Demand Class Details and four demand class outputs statistics:
| Intermittency | Variability | Demand Class | Clumpiness | Demand Class Details |
| Extremely Slow | Extremely Slow | |||
| Non-Intermittent | Smooth | Smooth | ||
| Non-Intermittent | Erratic | Erratic | ||
| Intermittent | Low Variable | Slow | Unit-Sized | Slow-LowVariable |
| Intermittent | Low Variable | Slow | Clumped | Slow-LowVariable |
| Intermittent | Low Variable | Slow | Slow-LowVariable | |
| Intermittent | Low Variable | Lumpy | Lumpy | |
| Intermittent | Highly Variable | Slow | Slow-HighlyVariable | |
| Intermittent | Highly Variable | Lumpy | Lumpy |
Last modified: Wednesday May 15, 2024