Generating your time series
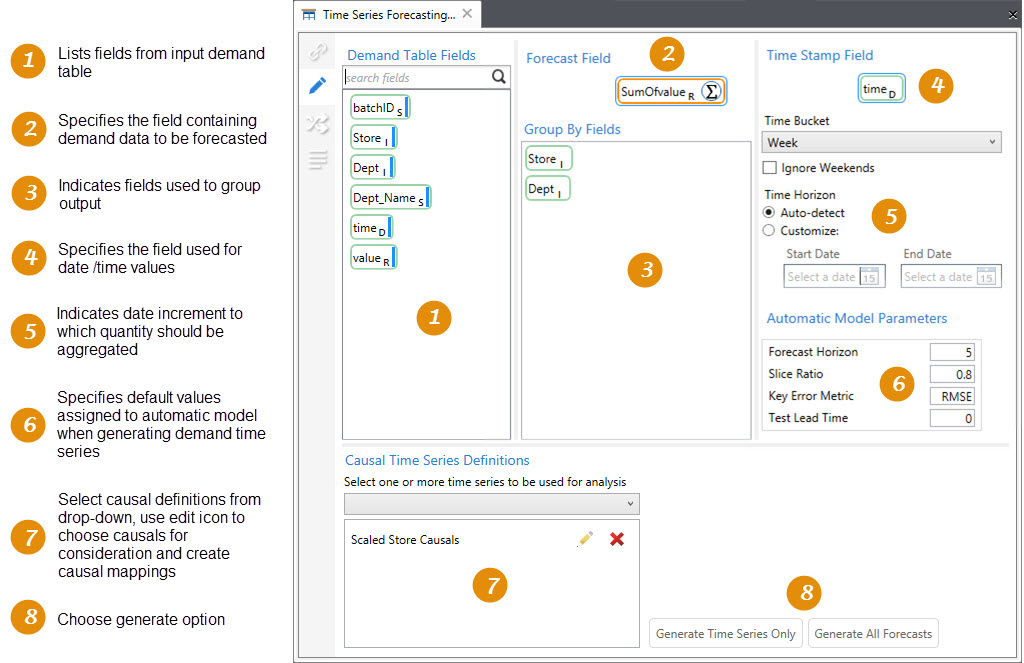
Use the Definition tab on the workbench to generate your demand time series, based in part on key fields you identify within your demand data and your selected time horizon. For demand forecasting, you can also generate your causal time series here.
Identify the key fields within your demand data
Use the Demand Table Fields on the Workbench Definition tab to populate your key demand fields. To populate these fields, drag and drop a field onto the appropriate icon, or double-click on the icon to select from a list of valid fields.:
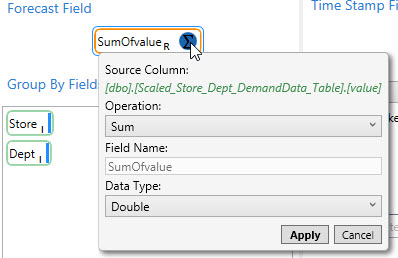
- For Forecast Field, identify the field that contains the demand data upon which the forecast is based. You can click the Function icon for additional aggregation configuration.
- For Group By Fields, specify the fields used to build each time series list.
- For Time Stamp Field, specify the field containing Date or Date/Time values.
Establish time increments and horizon
Use the options below the Time Stamp Field to aggregate data into time increments and establish the time horizon.
- For Time Bucket, choose the time increment into which your data is to be aggregated.
- Day
- Week
- Month
- Quarter
- Year
Each increment is considered a time period.
- Select Ignore Weekends to exclude Saturday and Sunday from consideration.
When data is aggregated from smaller time buckets to a larger time bucket, forecasting can be adversely affected if several values that comprise the larger time bucket are missing in the input data. One way this can occur is if the days accounted for in the smaller time buckets do not fit exactly into the days accounted for by the larger bucket. In this situation, any days that are within the larger time bucket but not provided as input in one of the smaller buckets are interpreted as having a value of zero.
For example, suppose you are aggregating data up to July 31, rolling up daily data into a weekly time bucket. If July 31 occurs on a Tuesday, and weekends are excluded, then the last week's data consists of only July 30 (Monday) and July 31 (Tuesday), creating a data point inconsistent with previous weeks that include 5 days each.
- For Time Horizon:
- Select Auto-detect to determine the horizon based on actual dates in the data.
- Select Customize to determine the horizon based on a specific dates, then enter or choose the Start Date and End Date.
Define parameters for Automatic model
For Automatic Model Parameters, specify the default values to use for these parameters in the Automatic Model when generating the Demand Time Series. This model is attached to each Demand Time Series, and it cannot be removed by the user. The values specified here can be overwritten on per model basis on the Demand Modeling tab
- For Forecast Horizon, indicate the number of time periods to include in the forecast.
- For Slice Ratio, use a ratio value between 0 and 1 that represents the amount of data needed to train the forecasting model.
- For Key Error Metric, specify the error metric used for algorithm optimization when running the Automatic, Tournament, or Ensemble algorithm.
You can overwrite the default metric of RMSE using MAE, MAPE, WMAPE, ME, or MPE. This allows you to choose the metric used for optimizing the parameters of individual algorithms; ultimately, this can help determine the best algorithm or best set of weights when the Automatic, Tournament, or Ensemble algorithm is run.
- For Lead Time, indicate the number of time bucket periods used to calculate lead time for out-of-sample MAPE. This field is blank by default and accepts values between 0-500.
Select causal time series to be considered
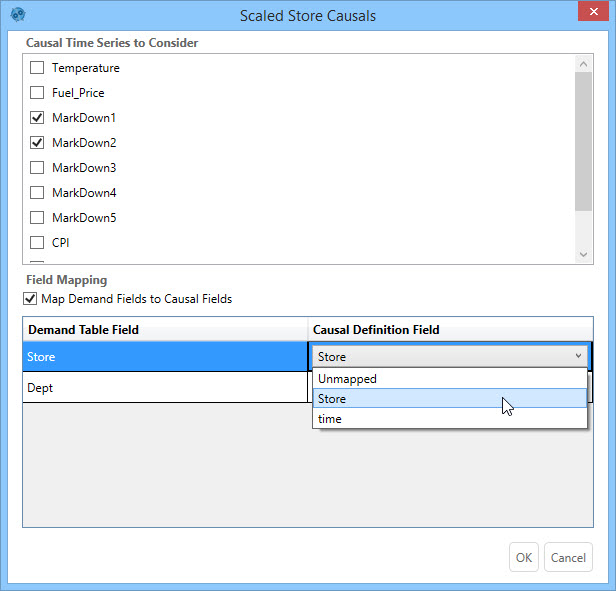
In the Workbench Definition tab, the definitions listed in Causal Time Series Definitions are created using Demand Guru's Causal Time Series Definition tool. Use this list to select the time series to be considered as causal factors in your demand analysis. Note that causal data is not considered for life cycle modeling.
- Click the icon next to a time series name to display a dialog that lists the causal fields within the time series.
- In Causal Time Series to Consider, select the checkbox next to each causal field to be included at runtime.
- Note that this dialog also includes a Field Mapping area that lists the demand table fields (Group By Fields) from your demand table.
You can use this area to create mappings between demand fields and causal fields if some causals have different values for different time series.
To map causal fields to fields in the demand table, select Map Demand Fields to Causal Fields to enable the Field Mapping area, then use the drop-down boxes in the Causal Definition Field column to select the causal field to which a demand field is mapped.

Select time series generation option
On the Definitions tab of the workbench, select one of the time series generation options:
- Generate Time Series Only – Click this button to identify each demand time series; for example, if you group by department, a demand time series is created for each department. If you will be using the clustering feature, you must choose this option.
- Generate All Forecasts – Click this button to identify each demand time series and then run the Automatic Model forecast for each of the generated demand time series.
Last modified: Thursday December 19, 2024