The time bucket
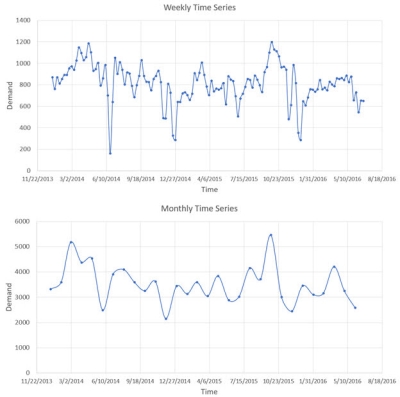
In a time series, the time interval between successive demand values is referred to as the time bucket, and it can be hourly, daily, weekly, monthly, quarterly, or yearly. Larger time buckets can “smooth” the time series but also lose details of the data, while smaller time buckets capture more minute details of the data but also unintentionally capture “white noise” (random fluctuations). The following graphs show the same time series presented in a weekly and monthly bucket. Note that the monthly bucket results in a smoother graph, but with less data points.
Generally, a time series with more data points helps forecasting algorithms learn more (understand patterns), which leads to better forecasts. Conversely, decreasing the time bucket size to increase the number of data points introduces random fluctuations in the data. Forecasting algorithms may capture these random fluctuations as patterns in the data, resulting in incorrect forecasts. Thus, a balance between the number of data points and smoothness of data is important. You can test multiple time bucket sizes to determine the proper level for a given data set.
Last modified: Thursday December 19, 2024

