Comparing Tournament and Ensemble algorithms
Each machine learning algorithm available in Demand Guru uses a different approach to self-learning demand patterns and causal drivers. Because of this, they each also tend to have different strengths. Some may detect better seasonal cycles or causal effects that are not immediately obvious, while some smooth out the noise in the demand signal or are better equipped for modeling non-linear trends.
Pure vs. blended approach
Although each algorithm by itself can model and predict demand, Demand Guru also provides options that allow you to take advantage of the results from multiple algorithms, either individually or collectively.
Using Tournament alogrithm to find best algorithm
When you use the Tournament selection to run a series of algorithms in tournament mode, Demand Guru selects the best one to use for forecasting based on its performance over out-of-sample data. In this case, the algorithm producing the lowest out-of-sample RMSE value is chosen for forecasting, and the results from the other algorithms are essentially ignored. The tournament approach generally works well if you are trying to determine the most suitable algorithm for a specific time series.
However, what if you want to combine the strengths of all algorithms being run to further improve your demand modeling and forecasting process?
When you use only the top-ranked algorithm, you essentially throw away forecasts from all other algorithms considered within the tournament. But what if the second-ranked algorithm can capture some data patterns that the top-ranked algorithm cannot? While the tournament results in the selection of an algorithm that likely identifies the most critical patterns of demand data, the second- or third-ranked algorithm can capture some information missed by the top-ranked algorithm. In other words, you may have an opportunity to improve your forecast accuracy by combining forecast results of multiple algorithms instead of simply choosing the best one. To do this, you can choose the Ensemble algorithm.
Using Ensemble algorithm to combine best of all algorithms
Instead of dismissing the results of sub-performing algorithms, the Ensemble algorithm provides a score (weight) to each algorithm based on its performance.
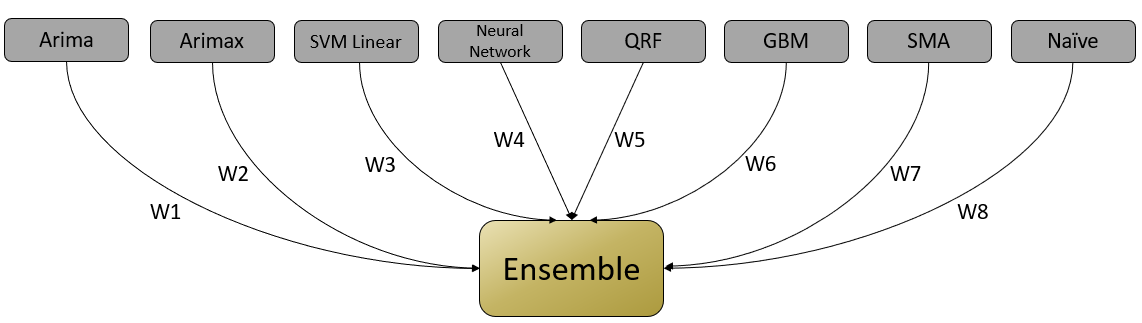
The weight assigned to each algorithm is based on three factors:
- In-sample error
- Out-of-sample error
- Rank of the algorithm
Generally, the lower the values of in-sample and out-of-sample errors, the better the ranking of the algorithm; thus, it tends to receive a higher weight. Once weights are assigned to the algorithms being considered, the Ensemble algorithm then takes forecasts given by each separate algorithm, multiplies them by the corresponding weights, then combines and normalizes them to get final blended forecasts.
Comparing sample results from Tournament and Ensemble algorithms
To illustrate the potential advantage of blending algorithms instead of relying solely on result of one algorithm identified as the best, the following tables show results from the Tournament and Ensemble algorithms on data from a single time series.
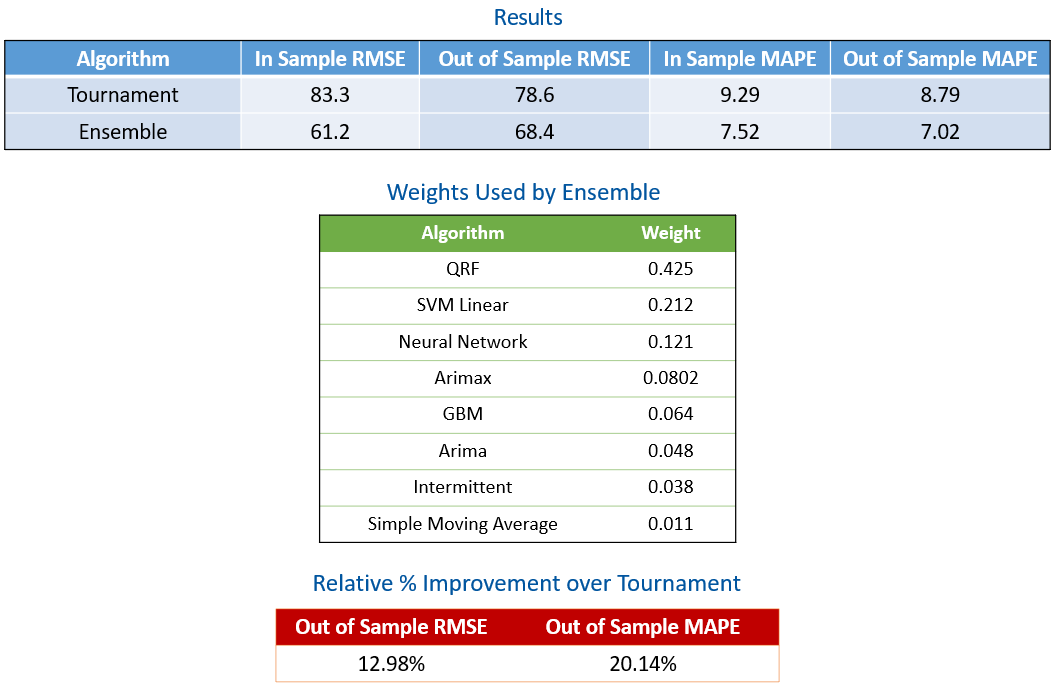
The blue table reveals that the Ensemble algorithm has improved the out-of-sample RMSE from 78.6 to 68.3 and improved MAPE from 8.79 to 7.02 over the Tournament algorithm. The green table shows weights assigned to various algorithms by the Ensemble algorithm. In this example, QRF (Quantile Random Forest) received the highest weight of 0.425. As shown in the red table, the Ensemble algorithm produced a relative improvement of approximately 13% in RMSE and approximately 20% in MAPE over the Tournament algorithm.
The following graph depicts the working of the Ensemble algorithm in a time series forecasting plot.
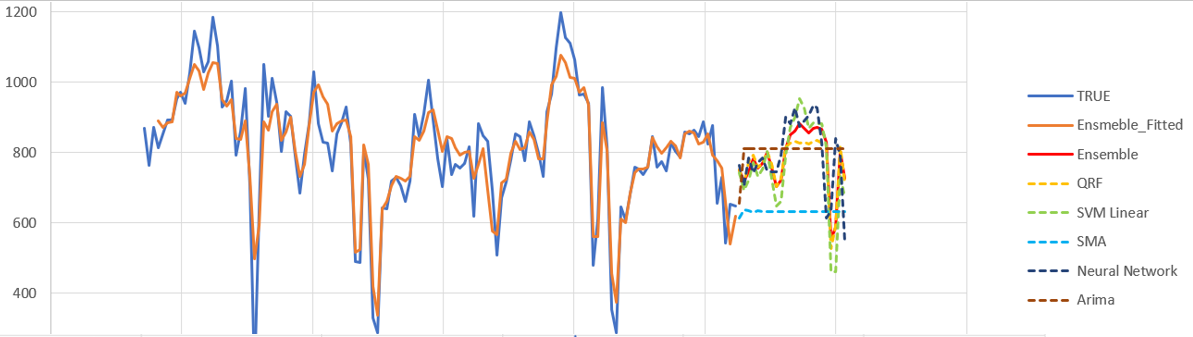
The graph includes the following:
- True values of demand data, shown as a solid blue line
- Fitted values given by the Ensemble algorithm, shown as a solid orange line
- Forecasts from different algorithms, represented by dotted lines
- Blended forecast produced by the Ensemble algorithm, represented by a solid red line
Note that the red line mostly overlaps with the yellow dotted line of the QRF (Quantile Random Forest) algorithm, which has received the highest weight. However, in the middle portion of the forecast horizon, the predictions by the Ensemble algorithm are boosted upward by the SVM Linear (green) and Neural Network (dark blue) algorithms.
When performed on 1399 monthly time series, the following results are generated:
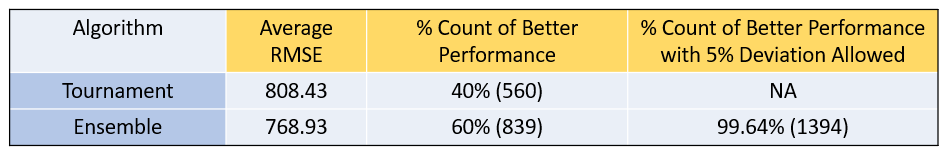
As shown, the average RMSE on hold-out data (where forecast horizon = 18) for the Ensemble algorithm is 768.93, compared to 808.43 for the Tournament algorithm. Of 1399 time series, the Ensemble algorithm provided more accurate results for 839 (approximately 60%), while the Tournament algorithm provided more accurate results for 560 (approximately 40%).
If we allow a 5% deviation between the Ensemble and Tournament results, then the Ensemble algorithm performed better or equal to the Tournament algorithm for an impressive 1394 of 1399 time series. These results suggest that the Ensemble algorithm will perform as well or better than the Tournament algorithm over 99% of the time.
Additional notes on the Ensemble algorithm
The Ensemble algorithm runs the following algorithms internally:
- Arima
- Arimax
- Model Average Neural Network
- Stochastic Gradient Boosting
- Intermittent
- Naïve Forecasting
- Quantile Random Forest
- Support Vector Machine (SVM Linear)
- Simple Moving Average
- Exponential Smoothing
If two algorithms produce very similar forecasts, then the forecasts produced by only one of the two algorithms are considered by the Ensemble algorithm.
Currently, options to specify the list of algorithms to be considered for the Ensemble algorithm and choosing their weights are not available. Future releases may make these options available.
Last modified: Thursday December 19, 2024