Choosing a clustering algorithm
In Demand Guru, you can cluster your time series using two approaches:
As described in Feature extractions for clustering, time series clustering is based on defining characteristics referred to as features. In addition to the features to be considered for clustering, you can also specify the number of partitions into which a group of time series should be split. This additional capability offers two unique variants of the clustering algorithm - an automatic variant in which you only provide the time series data, and a custom variant that also allows you to control both the set of features and the number of clusters.
Automatic clustering
In automatic clustering, you control the algorithmic variant that should be run while clustering. By default, when you open the clustering pane, an automatic cluster definition is prepared.
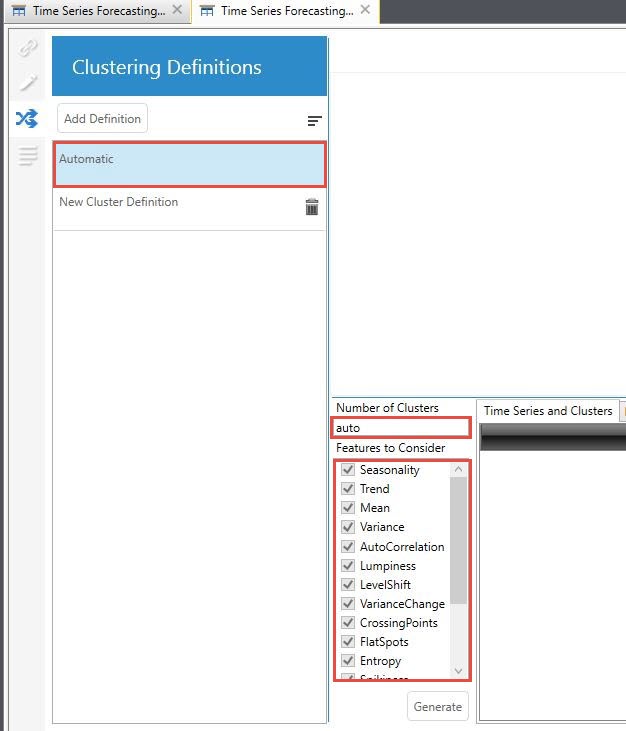
Note that the Number of Clusters parameter is set to auto, for which Demand Guru internally picks the best number of clusters between 2 - 20, and Features To Consider indicates that all 16 features are automatically selected for extraction.
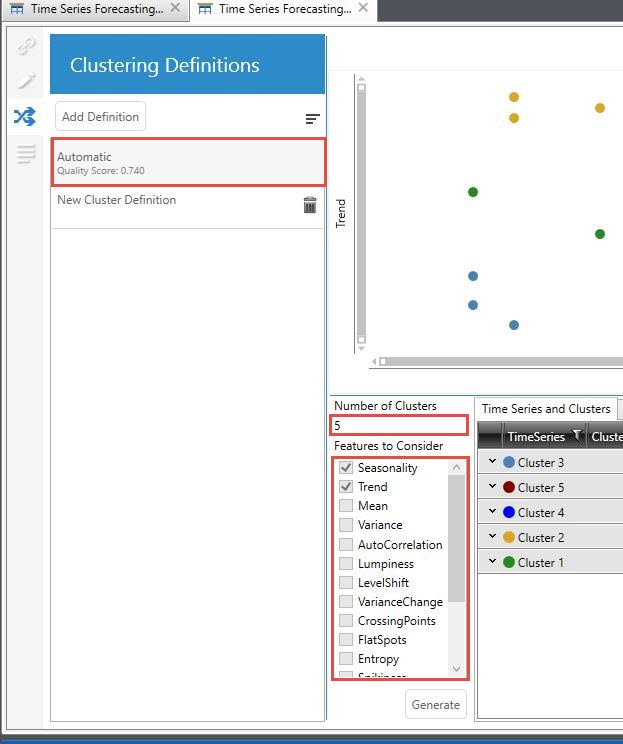
When clustering is run, only the features that were considered in the final definition remain checked. Also, the final number of clusters determined in the definition replaces the auto value in Number of Clusters.
User-defined clustering
In lieu of automatic clustering, you can choose your own variant of clustering by controlling the set of features to be considered and the number of clusters to be created. Unlike automatic clustering, in which a subset of the 16 features are selected in the final definition, user-defined clustering considers only all checked features, and the time series data is partitioned into the number of clusters you specify.
Quality Measurement
Clustering belongs to a class of machine learning called unsupervised learning, in which the ground truth or labels used to form relationships between time series are not available to train a model. This lack of a fixed basis for analysis makes it difficult to provide definitive guidance on the relative merits (quality) of a cluster definition, or to guide the selection of features or the best number of clusters. To overcome this obstacle, Demand Guru uses a measure of the quality of cluster, and lets it guide the clustering procedure.
Weighted Silhouette Index
To estimate the quality of the cluster, the application uses a modified version of a measure referred to as the Silhouette Index, which estimates how similar each time series is to the other time series present within its own cluster versus time series that are grouped into other clusters.
Once a cluster definition is fit (when all time series are partitioned into different clusters), the silhouette value is estimated in the following manner:
For every time series, denoted by i, the algorithm measures the distance (Euclidean distance between the feature scores) with every other time series within the cluster, and calculates an average of that score (intra-cluster score):
Di,within= Average distance between time series i, and all time series within its own cluster
Similarly, the algorithm produces an inter-cluster score for every time series i, by measuring the average distance with other time series belonging to other clusters (one cluster at a time), and calculating the minimum average distance to be the inter-cluster distance:
Di,neighbor= Minimum average distance between time series i, and all time series belonging to other clusters (each cluster considered individually)
The silhouette index for each time series is then calculated using the following:
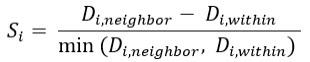
For example, if 7 time series {TS1, TS2, TS3, TS4, TS5, TS6, TS7} are clustered into 3 groups (C1, C2, C3), where C1 = {TS1, TS2, TS3}, C2 = {TS4, TS5, TS6}, and C3 = {TS7}, the intra- and inter-cluster distances for TS1 are calculated as follows:
DTS1,within=Average(d(TS1,TS2),d(TS1,TS3))
DTS1,neighbor=min(Average(d(TS1,TS4),d(TS1,TS5),d(TS1,TS6)),Average(d(TS1,TS7))
The average of the silhouette distances over all the time series present in the cluster is estimated to be the Silhouette Index measuring the overall quality. The silhouette index varies between -1 and 1. If the inter-cluster distance is smaller than the intra-cluster distance, values are reported as negative indicating bad clustering; conversely, positive values indicate inter-cluster distances are larger with widely separated clusters, where time series grouped together within each cluster are tightly packed, resulting in a better cluster definition.
Since the average silhouette index does not discriminate against clusters that are outliers, as in the previous example where C3 has one time series TS7, the algorithm produces a weighted average of the silhouette index for each time series, with the weights based on the size of the cluster. Therefore, a cluster definition that has partitioned several time series into approximately equal-sized clusters will produce a better overall average silhouette index than a cluster definition that has partitioned outliers into a separate cluster. When a cluster definition is executed, the Modified Silhouette Index that represents the overall weighted silhouette index is displayed.
Last modified: Thursday December 19, 2024