Machine Learning model
The Path Details table, which is an output of the Cost to Serve algorithm, is reported at the lane level. This table is read into the Supply Chain Prescriptions workflow from a Supply Chain Guru Model (SCGM) database and is then aggregated at path-product level. From this input various features are extracted at Site, Lane and Path level.
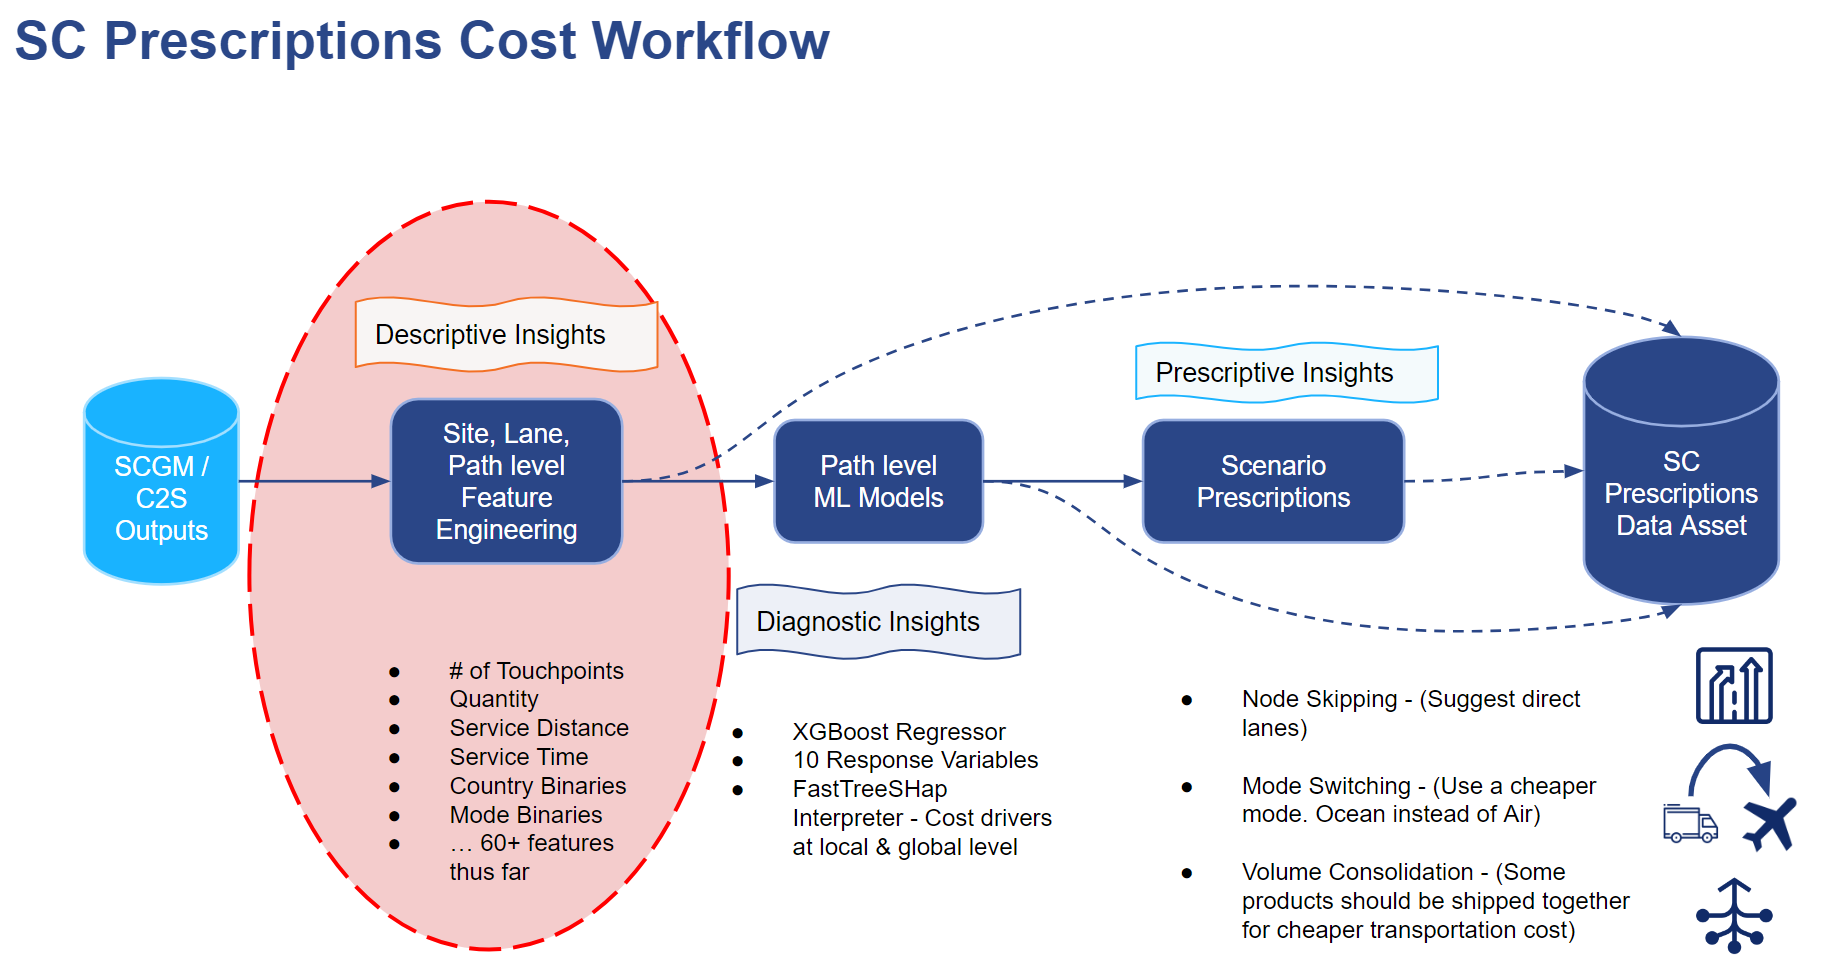
Features are extracted/engineered for the following reasons:
-
To show descriptive insights at Site, Lane and Path level and
-
To create input data for the Machine Learning model
The Path Details table includes paths where finished goods are stored as inventory at the DC’s and never reaches the customers. Similarly, to remove the infeasibility in the network, dummy sites are added without any location details.
These are incomplete paths and are removed from the path details before extracting path level features.
For information on the Cost to Serve analysis and the different costs reported, see Cost to serve analysis. For column descriptions of the PathsDetails table, see Cost To Serve Details.
Features are extracted to show Descriptive Insights at various levels (Site, Lane, Path, Cross Path End Points) and they are also used inside a Machine Learning model to understand various cost drivers.
Path level features used by the Machine Learning model
Path features are extracted at the Path-Product level. The categories and features for each Path-Product level are detailed here.
Distance based features
-
Customer Service Distance: Last Mile Distance between DC and the Customer
-
Interfacility Service Distance: Service distance between MFG and last DC before delivering to the customer
-
Total Service Distance: Total distance between Start Location (MFG) and End Location (Customer)
-
Geo Distance: Great-Circle distance in miles calculated between Start Location (MFG) and End location (Customer) using latitude and longitude with the help of Haversine formula
-
Distance Ratio: This is the Total Service Distance / Geo Distance
-
Distance Traveled by each mode : The total service distance covered by a path using a specific mode (For example: Air_Distance, LTL_Distance).
Time-based features
-
Customer Service Hours: Time to deliver the finished product from Customer facing DC to Customer
-
Interfacility Service Hours: Time to move the product from Start Location (MFG) to Customer facing DC
-
Total Service Hours: Total time to ship the product from Start Location (MFG) to End Location (Customer)
Binary features
-
Sites (MFG, DC, Customer): Different sites in a path are converted into binary features.
-
Countries (USA, Canada, etc): Countries in a path are converted into binary features. For example: If a path has an MFG or DC or Customer site present in a country, that country feature is assigned a value 1, else 0.
-
Direct Shipment: If a product is shipped directly from MFG to Customer, then direct shipment is marked as 1, else 0.
Structured-based features
-
Number of Unique Modes: This is the unique number of modes used by a product in a path
-
Total number of Touch points: This is the total number of DCs and MFG sites a product flows through in a path
-
Number of DC touch points: This is the number of DCs a product flows through in a path
-
Number of MFG touch points: This is the number of MFG sites a product flows through in a path
-
Modes (Parcel, Ground, Air, LTL etc): Modes used in a path are summed up at a path/product level and converted to features. For example: If a path has three lanes ( one with Air and 2 with LTL as modes), then Air and LTL are assigned as 1, 2 respectively and rest of the modes are assigned 0.
-
NumberOfCountriesInPath: This is the number of unique countries a product flows through in a path
Flow-based features
-
Total Demand Quantity
-
Demand Percentage: This is the Demand Quantity of a Product in a Path divided by the Total Demand Quantity of the same product across all paths (network)
-
Total Weight
-
Total Flow Unit Quantity
Cost-based features
-
Transportation Cost
-
Transportation + In-Transit Inventory Holding Cost
-
Production Cost
-
Sourcing Cost
-
Inbound Warehousing Cost
-
Outbound Warehousing Cost
-
Duty Cost
-
CO2 Cost
-
Facility Inventory Holding Cost
-
Intransit Inventory Holding Cost
-
Inventory Holding Cost
-
Total Cost
Business objective versions
For each of the cost based features, seven variations are calculated as features. These variations are used as a business objective to fit the Machine Learning model.
-
PerMile
-
PerPound
-
PerFlowUnit
-
PerFlowUnitPerMile
-
PerMilePerPound
Last modified: Friday May 12, 2023