Managing queues
Use the Queue Management page to view queue information for the following:
-
macro executions
-
model solves
-
task runs, including data flows
Other information available here includes design engine usage and statistics, along with related system data. You can also access and manage design engine classes from this page.
Queues available for viewing include those from the past 30 days.
Access the Queue Management page
- In the upper left corner of the Supply Chain home page, click Queue Management.
- Choose the type of queues to display from the left pane.
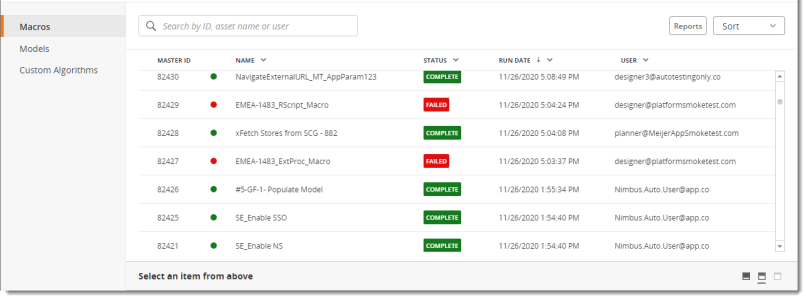
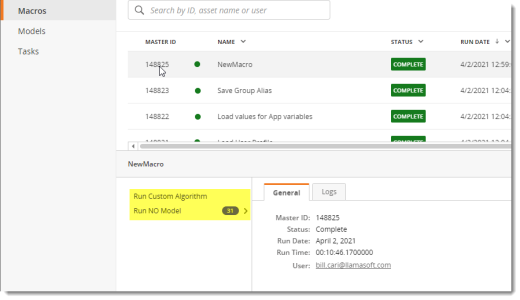
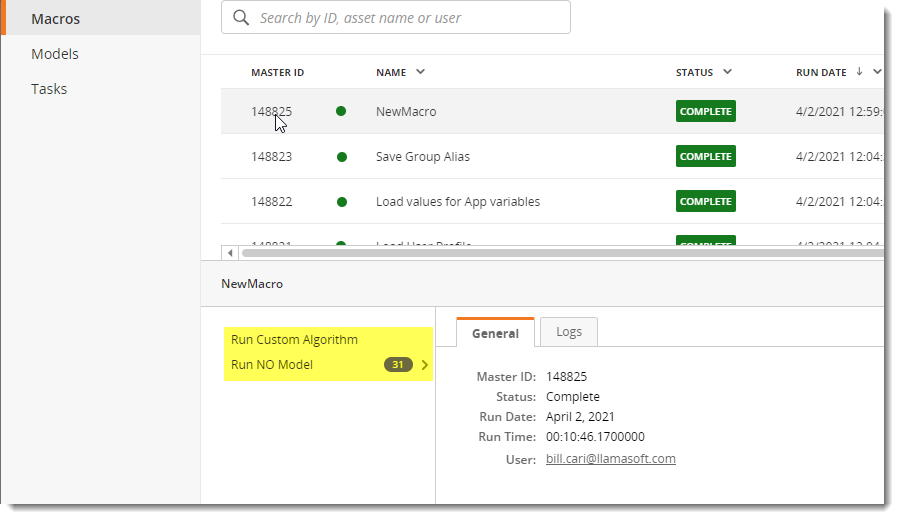
The Macros queue list is shown as follows:
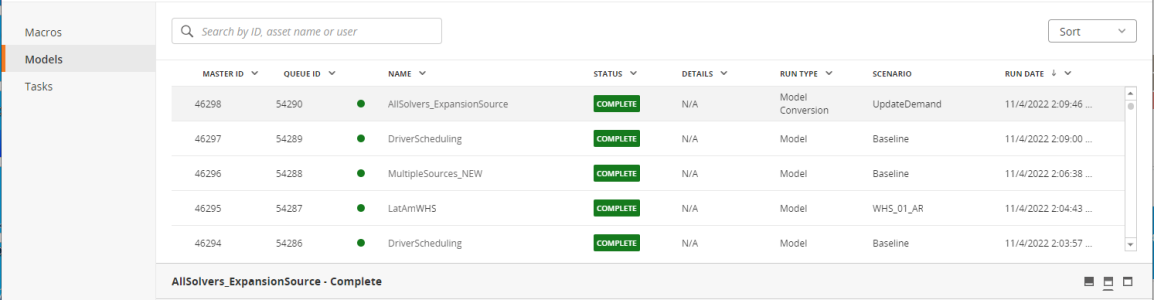
The Models queue list is similar to the Macros list, with additional fields:
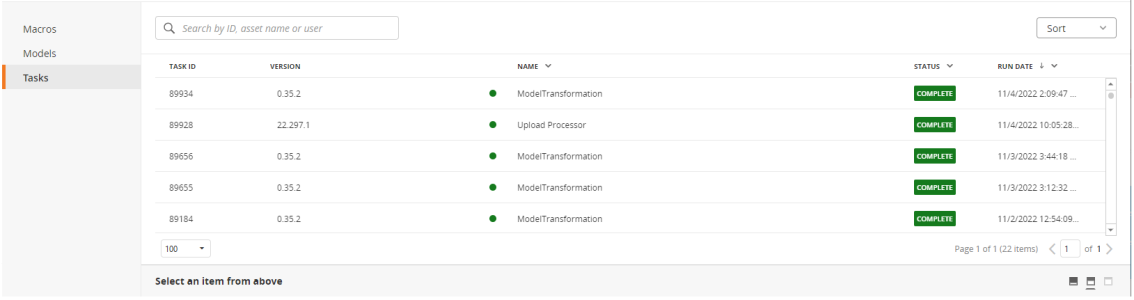
The Tasks queue list varies only slightly from the other two lists:


Each queue in the list includes:
- Master ID (for macro or model queues) or Task ID (for task queues) - a unique identifier assigned to the queue item
- Queue ID - displayed for model queues only, a unique identifier for the queue.
- Version - displayed for tasks only, the version of the containerized application used
- Name - the name of the macro, model or task; for model queues, you can click on the name to open the model (no link is available for any model that has been deleted). The current status of the macro execution, model solve, or task run is shown by a status icon to the right of the name:
 Waiting (N/A for macros)
 Busy or Stopping
 Stopped
 Completed
 Failed
- Status - the current status of the macro execution, model solve, or task run.
- Details (for model queues only) - additional information about the model queue results
- Run Type - displayed for model and macro queues, identifies the type of run as one of:
- Model (for solves)
- Solve Task (for solves)
- Macro
- Task
- Model Conversion
- App Builder
- App Developer
- App User
- Modeler
- Scenario (for model queues only) - the name of the scenario that was run
- Run Date - the date on which the macro, model, or task run began
- User - the user who requested the queue
They are displayed for users with any of the following roles:
A message appears in place of the queue list if no queue results are available, and you can refresh the screen to ensure no queues have been added.
Search for queues
- In the search box of the Queue Management page, type some search key words to find specific queues with strings that match the characters you enter.

As you type, matching results are displayed; otherwise, a message indicates that no results were found matching your string.
Filter queues
Some columns in the queue grid include a filter option that allows you to limit the display of rows.
- Click the appropriate column heading above the list of queues, and select Filter.
- Depending on the column, use the dialog to select or otherwise specify your filter criteria.
Once specified, the filter criteria is listed in the dialog. You can use the dialog to make additional selections.
- Click Apply. to filter the list based on your selections, or click Clear to remove your selections and return to the original search/sort settings.
View queue details
You can view the queue details of any models, macros, or tasks for which you have permissions.
- On the Queue Management page, locate and highlight the row containing the queue.
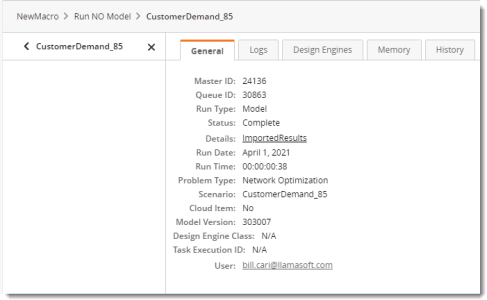
- Click on the row to display the details for that queue below the list. Initially, general details for the queue are displayed. This example shows model run details:
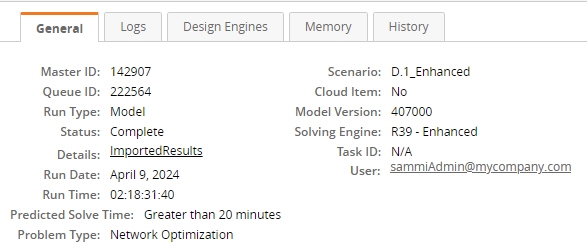
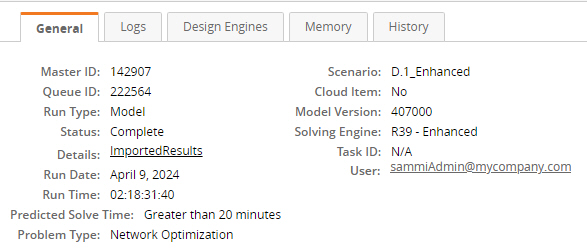
The fields displayed are based on your role and the run type (macro, model, or task):
- Master ID - displayed only for models and macros
- Queue ID - displayed only for models
- Task ID - displayed only for tasks
- App Builder Log ID - displayed only for macros
- Run Type - displayed for only for models and custom algorithms
- Predicted Solve Time - displayed only for models, for Network Optimization solves
- Status - the current status of the queue; for example, Busy, Complete, Stopped, and so on.
- Run Date - displayed only for models or macros, the date the queue was initiated
- Run Time - displayed only for models or macros, the elapsed time of the run or execution; when completed, this field displays total run or execution time
- Problem Type - displayed only for models, the solver technology used in the model run, which matches the Problem Type selected in Modeler; for example, Network Optimization or Simulation
- Scenario - displayed only for models, matches the Scenario selected in Modeler
- Cloud Item - displayed only for models, either Yes or No
- Model Version - displayed only for models
- Solving Engine - displayed only for models, the solving engine selected when running the solve.
- Task Execution ID - displayed only for model simulations or custom algorithms, available for items processed externally
- User - the name of the user who submitted the queue
-
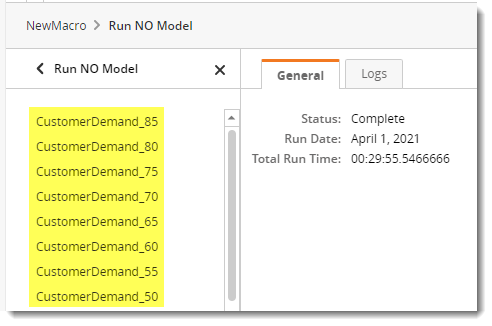
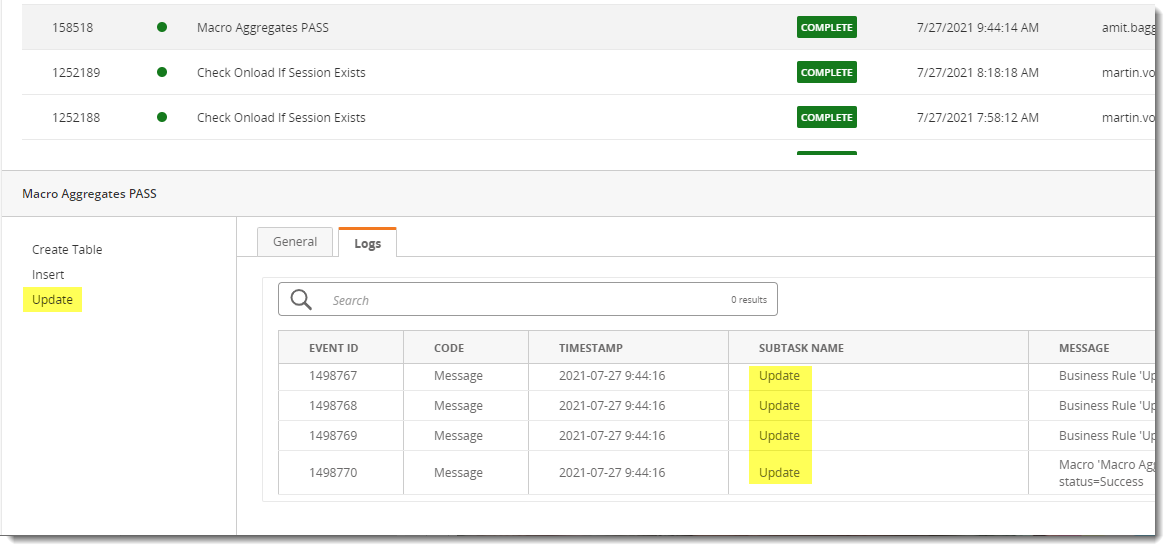
If you are viewing a macro's details, and the macro includes child macros, they are listed next to the details pane.
- Select a child macro to display its details. If the child macro contains children of its own, they are listed below the child you selected.
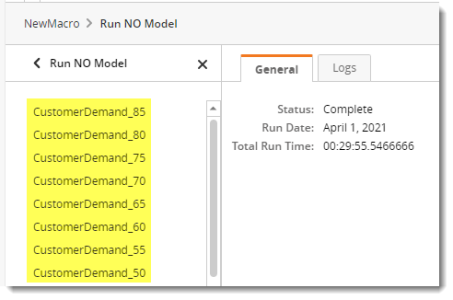
- Click one of the items in the list to display its details. For scenarios, additional tabs are displayed.
- Select a child macro to display its details. If the child macro contains children of its own, they are listed below the child you selected.
- Click each tab in the queue's details to display additional information. Available tabs depend on the queue selected.
- Logs – displayed for macros, models, and tasks. Displays a detailed log of activities for the item
- Design Engines – displayed for models. Displays run details for the last run of each type of Design Engine
- Memory – displayed for models. Displays detailed information on the memory usage of the model
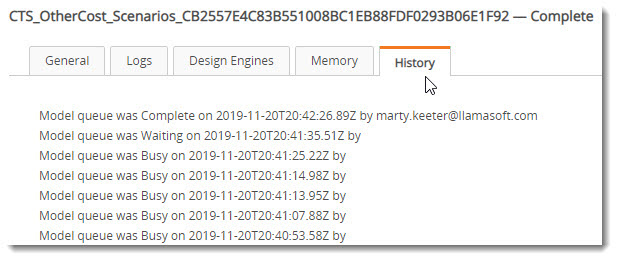
- History – displayed for models. Displays the status of the model over time

Stop a running queue
- On the Queue Management page, click on the queue to display its details.
- On the General tab -
- For a model or task, click Stop Run.
- For a macro, click Stop Macro.
Sort the queue list
Use the sort menu
- On the Queue Management page, click Sort in the top right corner of the page.
- Select a column from the list of sortable columns.
- Choose the order in which to display the selected sort option.
- Ascending
- Descending
When the list is sorted, an up or down arrow next to the selected column heading indicates the current order.
- On the Queue Management page, click the down arrowhead next to the name of the column.
If sort is enabled for the column, the sort choices are listed.
- Select the appropriate order.
When the list is sorted, an up or down arrow next to the column heading indicates the current order.
Control the page display
On the Queue Management page, you can change the amount of space occupied by the selected queue's details to better accommodate your viewing needs. For example, if you want to see more of the queue's details at the bottom of the page, such as extensive logs or history, you can increase the amount of space used to display the details; conversely, to view more of the list on the page, you can decrease the amount of space for the details.
You can adjust the space for each area in one of two ways:
- Use the icons on the right side of the queue details area
 to automatically change the display:
 - Select the left icon
 (default) to use the least amount of space for the details.
 - Select the middle icon
 to use about half of the space for the details.
 - Select the right icon
 to use the maximum amount of space for the details.
 -
Drag the horizontal line separating the two areas up or down to manually adjust the display.
You can also page through records, controlling the number of items per page:
-
Set the page size in the control at the left of the bottom of the grid.
-
Navigate through pages using the control at the right of the bottom of the grid.
Download solver input and output files
- On the Models tab of the Queue Management page, locate and highlight the row containing the queue.
- Click on the row to display the General details for that queue below the list.
- To the right of the queue's details, click Download Input Files to download a copy of the files that were input to the solver engine, or click Download Output Files to download a copy of the files that were output from the solver engine.
View and download queue logs
View logs
You can view logs for model, macro, and task queues.
- On the Queue Management page, locate and highlight the row containing the queue.
- Click on the row to display the details for that queue.
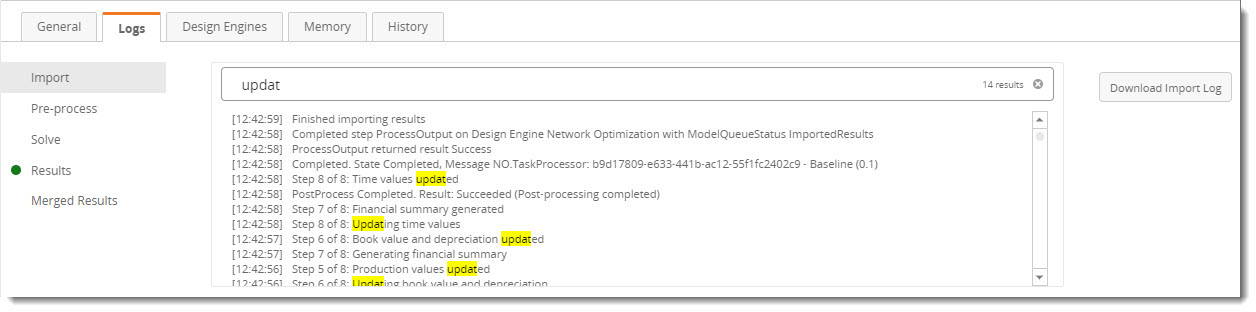
- Click on the Logs tab in the details to display the log results.
- Model queue logs - Logs are displayed by solve step. Initially, the logs of the last solve step successfully completed are displayed.
.You can select the solve step to be viewed:
- Import - the import of the upload packet
- Pre-process - the generation of files required for performing the solve
- Solve - the solve of the model
- Results - the import of the solve results into temporary tables
- Merge Results - the population of the model from the temporary tables and deletion of the temporary tables
Note that only those solve steps successfully completed are enabled for selection.
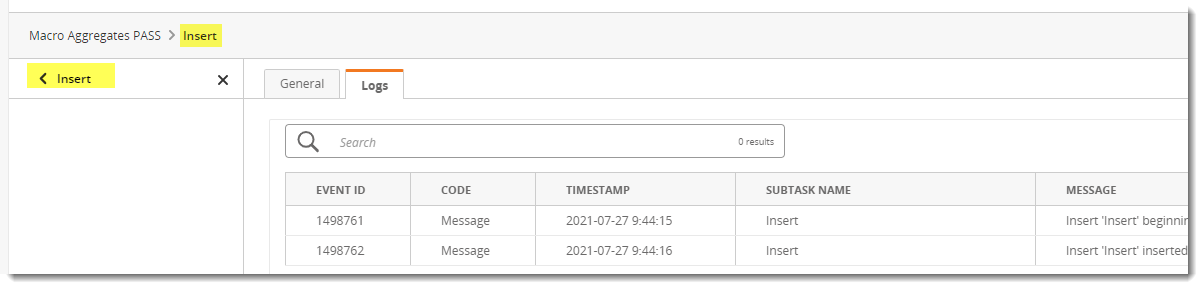
- Macro queue logs - Macros that contain child macros generate independent logs for each child. Initially, all child logs are included in the scrollable log table, with the logs of the last completed child macro displayed:
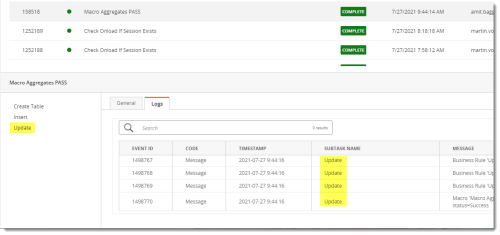
To view these separately, click on the child task.
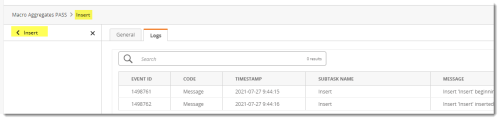
- Task queue logs - Logs are displayed as a continuous list, and you can scroll the list to view the logs.
- Model queue logs - Logs are displayed by solve step. Initially, the logs of the last solve step successfully completed are displayed.
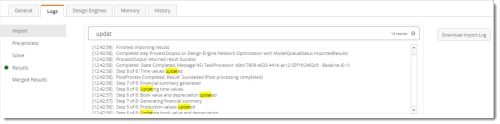
When viewing the logs, use the Search bar to locate specific entries.
Begin typing in the Search field. As you type, matching entries are highlighted in the logs, and the number of matching entries is displayed on the right side of the search bar.
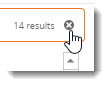
Click the icon next to the number of matching entries to clear the search string and its results.
 .
.
Download logs
You can download logs for model solves and task runs:
-
On the Logs tab, select the step or task from the left side of the pane.
When you select a log, the label on the download button changes to reflect your selection; for example, selecting the Solve step changes the label to Download Solve Log.
-
Click the download button.
View design engine information for a model queue
- On the Models tab of the Queue Management page, locate and highlight the row containing the queue.
- Click on the row to display the details for that queue.
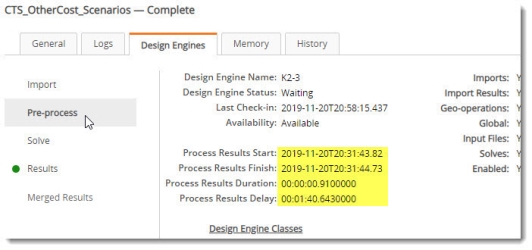
- Click on the Design Engines tab in the details to display information about the design engine(s) used for the solve,
with the design engine details for the last successfully completed solve stage displayed.
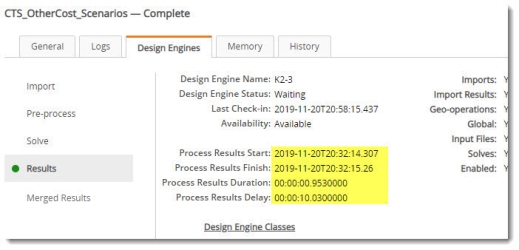
- Click on one of these stages to the left of the details to display the design engine details for that stage. Note the differences in solve values.
- Click Design Engine Classes to open the Design Engine Classes page in a new window, from which you can view specific information about all available design engine classes. Note that this link is not available for the Modeler role.


View memory statistics for a model queue
- On the Models tab of the Queue Management page, locate and highlight the row containing a queue.
- Click on the row to display the details for that queue.
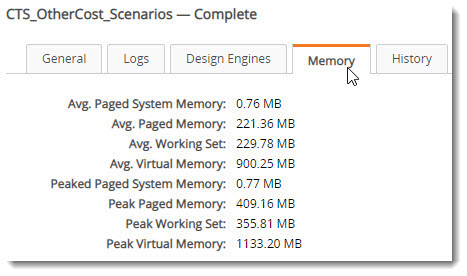
- Click on the Memory tab in the details to display the memory statistics noted for that queue.
-
Avg. Paged Memory - the average amount of paged virtual memory used during the solve.
-
Avg. Paged System Memory - the average amount of paged virtual memory used by the system.
-
Avg. Working Set - the average amount of memory that was required per time interval.
-
Avg. Virtual Memory - the average amount of virtual memory used during the solve.
-
Peak Paged Memory - the largest amount of paged virtual memory used during the solve.
-
Peak Paged System Memory - the largest amount of paged virtual memory used by the system.
-
Peak Working Set - the highest amount of memory that was required per time interval.
-
Peak Virtual Memory - the highest amount of virtual memory used during the solve.
View the history of a model queue
- On the Models tab of the Queue Management page, locate and highlight the row containing a queue.
- Click on the row to display the details for that queue.
- Click on the History tab in the details to display the memory statistics noted for that queue.
Last modified: Friday May 12, 2023