Inter-drop distance
The inter-drop distance (IDD) is the average distance between two drops within a transportation region.
- Inter-drop distance is calculated using a function of:
- Area of the transportation region – This is defined by the polygon enclosing customers and sites assigned to the region. You can override the calculated area using the Area Override field in the Transportation Regions table.
- Number of drops per day – This value is based on the density of customers in the region. Low density regions will have a smaller number of drops per day.
- Number Of Days To Schedule Transportation – This is a field in the Multi-Stop Estimation Vehicle Cost table. It is used to calibrate the results. When the Number Of Days To Schedule Transportation is increased, the IDD is reduced, since it is assumed that additional time to schedule results in more accurate and effective results.
- The area of the transportation region affects the inter-drop distance:
- Smaller region areas result in a smaller inter-drop distance.
- Low density regions (those with few customers) have a smaller number of drops per day. In this case, the inter-drop distance increases.
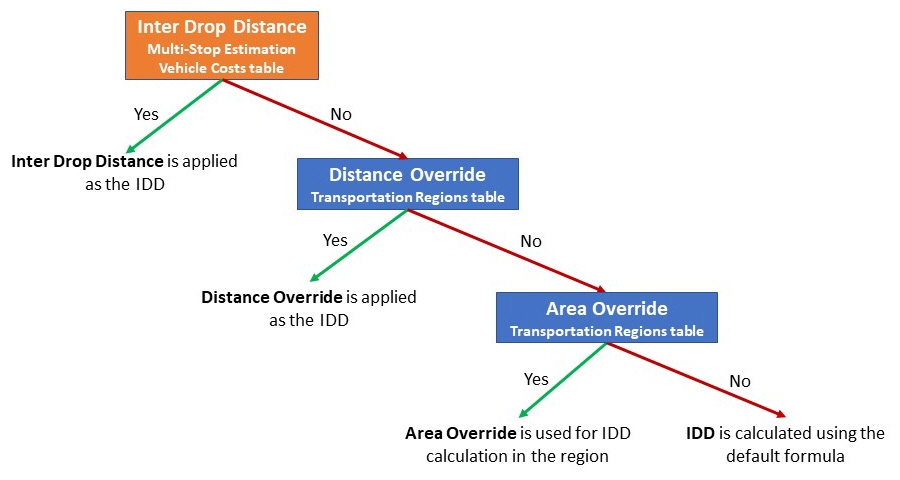
You can override the IDD in one of the following ways:
- Use the Area Override column in the Transportation Regions table. Area overrides are applied only if you select the “Use Transport Region Override Area” option in Multi-stop estimation options. You can use this value to influence the calculation of the IDD while still considering the occurrences and mix of customers in the region.
- Use the Distance Override column in the Transportation Regions table. Distance overrides are applied only if you select the “Use Transport Region Override IDD” option in Multi-stop estimation options. This value overrides the IDD for all customers in the region.
- Use the Inter Drop Distance column in the Multi-Stop Estimation Vehicle Cost table. This value enforces the same IDD for all policies that use the cost and does not take into account transportation regions.
The logic for applying the three options above is as follows, based on which options are populated with values:
The average inter drop distance is calculated as:
the square root of the area of the region
divided by the filtered uncombined number of customer deliveries in the area per the delivery scheduling window
multiplied by a constant (the Number Of Days To Schedule Transportation).

In terms of Modeler tables and columns this is:

For example, assume there are 25 customers within a transportation region. The most uniform scattering of locations is to space them evenly within a grid with the dispersion of the customers along each side of the grid being equal to 25^0.5.
The square root of the area becomes the average width of one side of the grid, and the square root of the number of locations becomes the number of customers that would fill one length of the grid.
The number of deliveries per day is multiplied by the delivery scheduling window (in days) to reflect the routing of deliveries. Examples of the calculation of routed deliveries include:
- If the delivery scheduling window is a 5 day work week, then the routed deliveries is the number of deliveries in a week.
- If the deliveries are received randomly for next day delivery, then the routed deliveries is the deliveries in 1 day.
- If the deliveries are received for next day delivery but the region is split up into delivery days so that a route can be planned to a specific area on a day then the routed deliveries is the deliveries for the week.
- If orders are received randomly and the scheduler has 2 days to deliver, then the routed deliveries is the deliveries over 2 days.
Last modified: Friday May 12, 2023