IO Forecast Options
These options are also on the Safety Stock Optimization: Advanced tab.
Forecast Time Bucket
Select the period by which forecast profile and forecast history are aggregated. The value should be consistent with the data in the Customer Forecasts table. This is one of Daily, Weekly, Monthly, Quarterly, Semi Annually, Annually. The default is Monthly. When setting this value in a scenario, select the “Forecast Time Bucket” Inventory Optimization Options field and select one of the values listed above.
Forecast Error Type
Select the method to use to determine the accuracy of the forecast. The value should be consistent with the data in the User Defined Customer Forecast Profile table. This is one of Standard Deviation, Mean Square Error, Mean Absolute Deviation, Mean Absolute Percentage Error, Percentage. The default is Standard Deviation. For descriptions of each of these methods, refer to Measuring forecast performance. When setting this value in a scenario, select the “Forecast Error Type” Inventory Optimization Options field and select one of the values listed above.
Handle Forecast Bias
Select this option to have the solver deal with forecast bias. When selected, the solver will use the Forecast Bias Metric value and the Forecast Bias Method value to determine how the bias is handled. The default is not selected. When setting this value in a scenario, select the “Handle Forecast Bias” Inventory Optimization Options field and select "Yes".
Forecast Bias Metric
Select the metric to be used to determine if the forecast history is biased. This is one of Empirical, Tracking Signal, Normalized Forecast Metric. The default is Empirical. This option is available only when Handle Forecast Bias is selected. When setting this value in a scenario, select the “Forecast Bias Metric” Inventory Optimization Options field and select one of the values listed above.
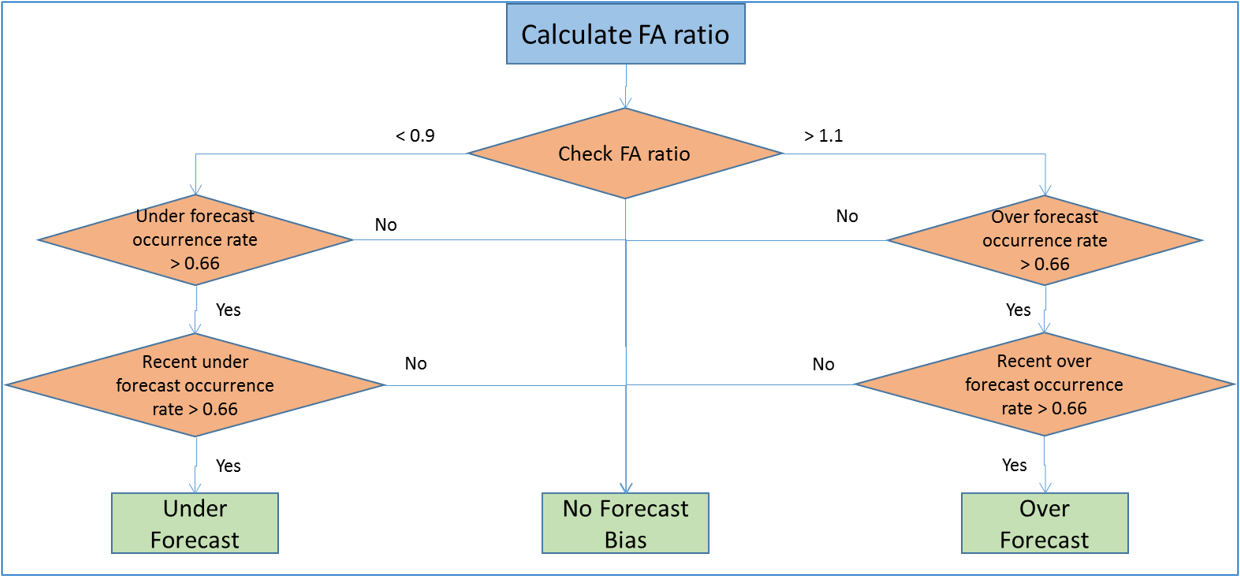
- Empirical: Calculate FA (forecast/actual) ratio, under/over forecast occurrence rate and recent under/over forecast occurrence rate. Then follow the flow chart as shown below to determine if the forecast history is under/over forecasting.


- Tracking Signal: Calculate the tracking signal, then follow the flow chart as shown below to determine if the forecast history is under/over forecasting. In the chart, n is the number of forecast records.

![]()
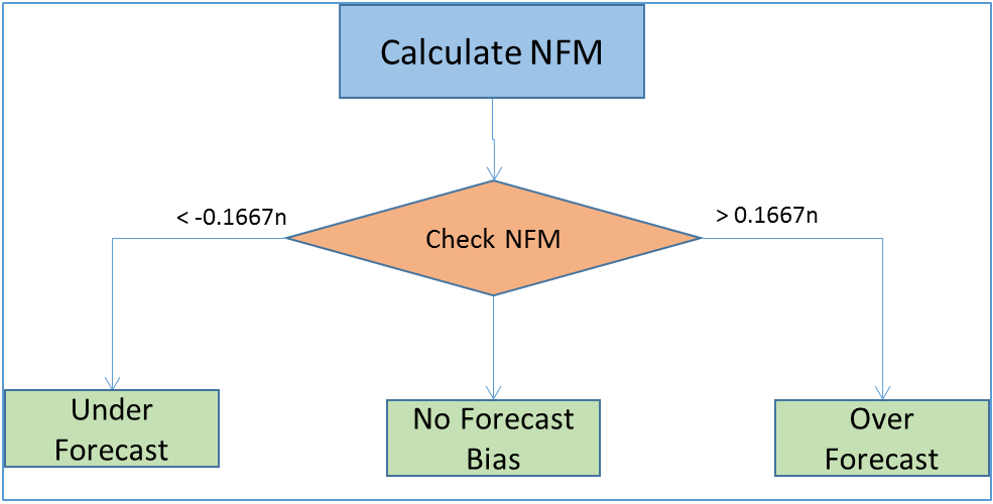
- Normalized Forecast Metric: Calculate the normalized forecast metric, then follow the flow chart as shown below to determine if the forecast history is under/over forecasting. In the chart, n is the number of forecast records.

Forecast Bias Method
Select the method to be used to adjust the biased forecast error standard deviation. This is one of Empirical, Certain Percentage. The default is Empirical. his option is available only when Handle Forecast Bias is selected. When setting this value in a scenario, select the “Forecast Bias Method” Inventory Optimization Options field and select one of the values listed above.
- Empirical:
Over-forecast:


Under-forecast:


- Certain Percentage (default percentage = 0.8):
Over-forecast:

Under-forecast:

Last modified: Friday May 12, 2023