Demand forecasting overview
Demand Modeler is a production-grade tool used for automating time series modeling and forecasting workflows, which includes automatic training and tuning of various algorithms within a user-specified time-limit. Modeling begins after the data has been loaded and transformed, features have been identified, and the data has been analyzed.
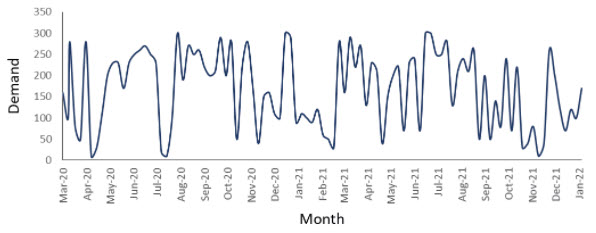
Demand forecasting can be used for planning and management of inventory and resources, and accurate forecasting can ultimately lead to cost savings. A sequence of data points taken at successive and equally-spaced time intervals forms a time series, which is generally plotted with time along the X-axis and demand along the Y-axis.
The following graph represents a sample monthly time series, with total demand data available for each month.

In Demand Forecasting, considerations include:
Time Aggregation - At what time increment should forecasts be generated; for example, one per day, week, month, quarter, or year?
Level of Detail (LOD) - At what level of detail should the forecast be generated?
Forecast Horizon - How far into the future should forecasts be generated?
Algorithms - Which ones should be considered for generating forecasts?
Error Metrics - How will forecast performance be evaluated?
Backtesting - Which algorithm should perform each forecast, and how is the expected performance of each forecast determined?
Forecasts vs. Predictions
While the terms forecast and prediction are often used interchangeably, their correct usage is different depending on the problem at hand.
Forecasting problems are a subset of prediction problems, in which predictions are made about the future. Generally, when time is the most important dimension and the goal is to predict an unseen future, this is more accurately described as forecasting.
One of the most important assumptions in Time Series Forecasting is that factors influencing the past and present will continue their influence in the future. Time is the most important dimension in time series forecasting, and most of its methodology has been built around this concept. The main difference between forecasting and prediction is the explicit addition of temporal dimension in forecasting.
In short, all forecasts are predictions, but not all predictions are forecasts,which use regression to explain the relationship between two variables.
Level of Detail
The Level of Detail (LOD) refers to the fields that make a time series unique. Demand forecasting generally builds location-level and item-level forecasts. In this case, location and item are the level of detail of the problem at hand. This would be a two-dimensional problem, where dimension one is location and dimension two is item. The LOD is also known as Time Series Granularity, Time Groups, Aggregation Keys, or Partitions.
Algorithms vs. Estimators
While the terms algorithm and estimator are also often used interchangeably, they have different definitions.
An algorithm is a procedure that accepts arguments as inputs and returns predictions as outputs. Examples supported by Demand Modeler include Exponential Smoothing, SVM Linear, and Stochastic Gradient Boosting, among others.
By contrast, an estimator can be considered an instance of an algorithm, in which the algorithm’s arguments (features, hyperparameters, transformations, and so on) are defined.
For example, suppose a modeler wants to use the SVM Linear algorithm to generate forecasts for all LODs, but with a unique set of features for each LOD. Although only one algorithm would be used, a number of estimators would be created, since each LOD would be assigned to a unique instance of the algorithm. However, if the modeler wants one set of features for half of the LODs and another set of features for the remaining LODs, then just two estimators are created, with one assigned to half of the LODs and another assigned to the remaining LODs.
Last modified: Friday May 12, 2023
