Type 2 (Undershoot)
This service type considers undershoot, or the amount by which the inventory on hand is below the reorder point, in the Safety Stock calculation.
It assumes that when the replenishment lead time starts, the inventory on hand is below reorder point by the undershoot value. The effect of undershoot on Safety Stock is related to the demand mean variability.
In the presence of the undershoot effect, the Reorder point must cover the demand during lead time (LTD) and the undershoot (U).

The formulation for Type 2 (Undershoot) is given as:

where:
 is the expected shortage at the end of the replenishment cycle,
 is the expected shortage at the beginning of the replenishment cycle,
 is the batch size (replenishment order.
In addition, lead time demand parameters (mean and variance) are corrected by taking into account the undershoot parameters:
*corrected lead time demand mean = lead time demand mean + undershoot mean
*corrected lead time demand variance = lead time demand variance + undershoot variance
In this sense, Type 2 (Undershoot) considers both undershoot and expected shortage at the beginning of a cycle when the replenishment order is received. Based on the value of Q, Type 2 (Undershoot) adjusts the expected shortage during the cycle. On the other hand, Type 2 (Quantity Fill Rate) does not adjust its expected shortage based on the Q input. If Q is large enough, then  is negligible. In this case, Type 2 (Undershoot) yields more safety stock because of the corrected lead time demand parameters.
Therefore, Type 2 (Quantity Fill Rate) and Type 2 (Undershoot) are not comparable. They have different assumptions and formulas. Type 2 (Quantity Fill Rate) is a standard formula and is used as the default (displayed as “Type2” in Safety Stock Optimization output). Type 2 (Undershoot) includes additional assumptions and is a proprietary formula (displayed as “Type2_UnderShoot)” in Safety Stock Optimization output).
The following examples illustrate the effect of a small Q and a large Q on the safety stock yield, comparing Type2 and Type2_UnderShoot.
Case 1: Small Batch Size (Q=1)
When Q = 1, Type2 yields a higher Safety Stock than Type2_UnderShoot:
Production Policies
|
Minimum Order Quantity |
Fixed Order Time |
Site Name |
Product Name |
Production Policy |
|
1 |
10 |
MFG |
Product |
Make |
Customer Sourcing Policies
|
Source Name |
Customer Name |
Product Name |
Sourcing Policy |
|
MFG |
CZ |
Product |
Single Source |
Inventory Policy Summary - Type2_UnderShoot
|
Site Name |
Product Name |
Period Name |
Target Service |
Service Type |
Safety Stock |
|
MFG |
Product |
SinglePeriod |
0.95 |
Type2_UnderShoot |
38 |
Inventory Policy Summary - Type2
|
Site Name |
Product Name |
Period Name |
Target Service |
Service Type |
Safety Stock |
|
MFG |
Product |
SinglePeriod |
0.95 |
Type2 |
86 |
Case 2: Large Batch Size (Q=50)
When Q = 50, Type2_UnderShoot yields a higher Safety Stock than Type2:
Production Policies
|
Minimum Order Quantity |
Fixed Order Time |
Site Name |
Product Name |
Production Policy |
|
50 |
10 |
MFG |
Product |
Make |
Customer Sourcing Policies
|
Source Name |
Customer Name |
Product Name |
Sourcing Policy |
|
MFG |
CZ |
Product |
Single Source |
Inventory Policy Summary - Type2_UnderShoot
|
Site Name |
Product Name |
Period Name |
Target Service |
Service Type |
Safety Stock |
|
MFG |
Product |
SinglePeriod |
0.95 |
Type2_UnderShoot |
21 |
Inventory Policy Summary - Type2
|
Site Name |
Product Name |
Period Name |
Target Service |
Service Type |
Safety Stock |
|
MFG |
Product |
SinglePeriod |
0.95 |
Type2 |
8 |
Case 3: Varying MOQ Summary
In this case, we look at the impact on Type2 vs. Type2_UnderShoot for different values of MOQ in comparison to their demand during a cycle. Type2 is more sensitive to Q when Q is significantly less than demand during a cycle.
In Type2, the batch size is considered the cycle time demand. This is the denominator in the Type2 formula:
Type2 Service Level = 1 – Expected shortage / Cycle time demand
When the expected shortage for Type2_Undershoot is calculated, the effect on backorders is considered because of the small value of Q. As a result, Type2_Undershoot is less sensitive to batch size changes:
Type2_Undershoot Service Level = 1 – (Expected shortage at the end of the cycle* – Expected shortage at the beginning of the cycle*) / Cycle time demand
|
Site Name |
Product Name |
Period Name |
Target Service |
Service Type |
Safety Stock |
Batch Size |
|
DC |
Product |
SinglePeriod |
0.95 |
Type2 |
1541 |
1 |
|
DC |
Product |
SinglePeriod |
0.95 |
Type2_UnderShoot |
465 |
1 |
|
Coverage |
Demand Mean |
Demand Std Dev |
Lead Time Demand Dist |
Lead Time Demand Mean |
Lead Time Demand Std Dev |
|
20 |
6.51341 |
39.44544 |
Mixture of Distributions |
130.2682 |
176.4054 |
The Safety Stock varies between Type2 and Type2_UnderShoot as the batch size is adjusted:
|
Batch Size |
Type2 |
Type2_UnderShoot |
|
1 |
1541 |
465 |
|
51 |
665 |
442 |
|
101 |
516 |
419 |
|
151 |
429 |
397 |
|
201 |
368 |
377 |
|
251 |
321 |
358 |
|
301 |
283 |
340 |
|
351 |
251 |
323 |
|
401 |
223 |
307 |
|
451 |
199 |
292 |
The graph below further illustrates the sensitivity of Type2 to changes in batch size:
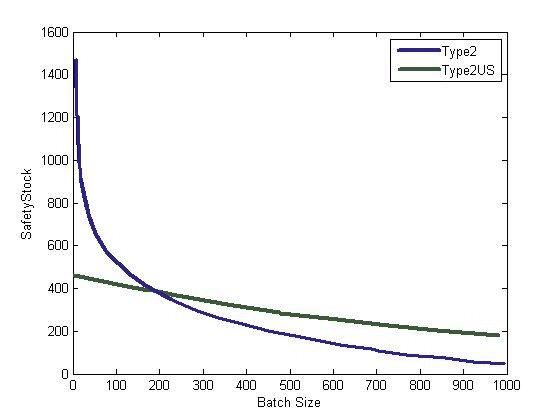
As a result, it is important to have the right MOQ and Replenishment Frequency information. If you are not sure of your MOQ values, Replenishment Frequency is actually a more accurate representation of demand during a cycle.
Last modified: Wednesday May 15, 2024