Site Product Summary
Internal Table Name: SimulationOutputSiteProductDetail
This table shows detailed information at the site-product level, including inventory values. This table contains a unique record for each site, product, scenario, replication and period combination.
Scenario
Table: SimulationOutputSiteProductDetail
Internal Name: Not Applicable (Scenario column not in table)
Displays the name of the scenario which generated the site-product detail data.
Product Name
Table: SimulationOutputSiteProductDetail
Internal Name: ProductName
Displays the name of the product referred to in the report.
Site Name
Table: SimulationOutputSiteProductDetail
Internal Name: SiteName
Displays the name of the site referred to in the report.
Organization Name
Table: SimulationOutputSiteProductDetail
Internal Name: OrganizationName
The Organization to which the site-product details are allocated. When the product is assigned to a Site that belongs to the Organization, the site-product details are attributed to the Organization as required.
Total Demand
Table: SimulationOutputSiteProductDetail
Internal Name: TotalDemand
If the site has demand (as defined in the Site Demand table), this is the total demand for the site in the period.
Total Revenue
Table: SimulationOutputSiteProductDetail
Internal Name: TotalRevenue
If the site has demand (as defined in the Site Demand table), this is the total revenue for the site in the period based on product Price.
Lost Demand
Table: SimulationOutputSiteProductDetail
Internal Name: LostDemand
Displays the number of units demanded by the site that were canceled or lost during the specified period.
Lost Revenue
Table: SimulationOutputSiteProductDetail
Internal Name: LostRevenue
Displays the lost revenue due to canceled or lost units demanded by the site during the specified period.
Initial Inventory Units
Table: SimulationOutputSiteProductDetail
Internal Name: InitialInventoryUnits
Displays the inventory of the product at the site at the beginning of the period.
Average Inventory Units
Table: SimulationOutputSiteProductDetail
Internal Name: AverageInventoryUnits
Displays the time-weighted average inventory for this product at this site in the specified period:

where:
U = Inventory Units
T = Time
P = Total time in the period
n = change in U
For example, assume time series inventory levels such as:
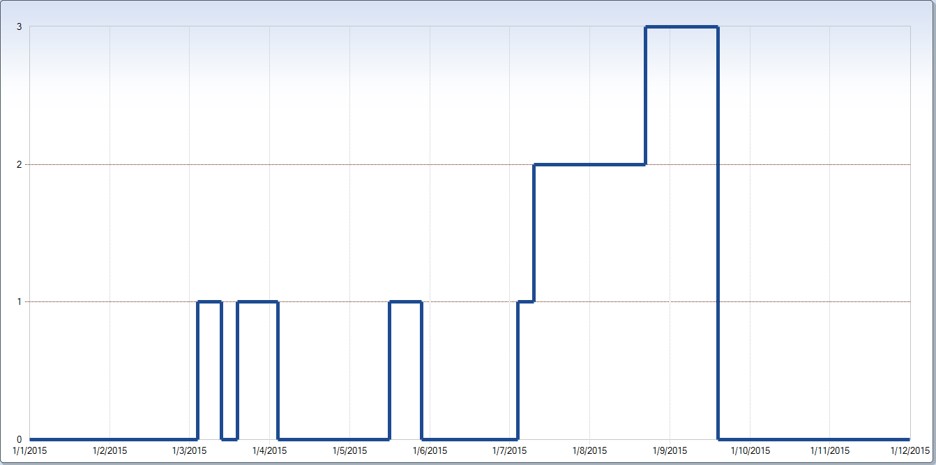
The events are:
| Event Time | Site | Product | Time Lapse (Days) |
Inventory Qty per Time |
On Hand Inventory |
|---|---|---|---|---|---|
| 1/1/2015 00:00 | MFG | PRODUCT_A | - | - | |
| 1/3/2015 02:24 | MFG | PRODUCT_A | 2.1 | 0 | 0 |
| 1/3/2015 09:36 | MFG | PRODUCT_A | 0.3 | 0.3 | 1 |
| 1/3/2015 14:24 | MFG | PRODUCT_A | 0.2 | 0 | 0 |
| 1/4/2015 02:24 | MFG | PRODUCT_A | 0.5 | 0.5 | 1 |
| 1/5/2015 12:00 | MFG | PRODUCT_A | 1.4 | 0 | 0 |
| 1/5/2015 21:36 | MFG | PRODUCT_A | 0.4 | 0.4 | 1 |
| 1/7/2015 02:24 | MFG | PRODUCT_A | 1.2 | 0 | 0 |
| 1/7/2015 07:12 | MFG | PRODUCT_A | 0.2 | 0.2 | 1 |
| 1/8/2015 16:48 | MFG | PRODUCT_A | 1.4 | 2.8 | 2 |
| 1/9/2015 14:24 | MFG | PRODUCT_A | 0.9 | 2.7 | 3 |
| 1/11/2015 23:59 | MFG | PRODUCT_A | 2.4 | 0 | 0 |
| T=10.99999 | Q=6.9 | ||||
| Average Inventory Units: | 0.63 | ||||
Time Lapse (T) = Total time between period beginning and period end.
Inventory Qty per Time (Q) = On Hand Inventory by total time between events.
Weighted Average Inventory Units = [Sum(Q)/T]
Ending Inventory Units
Table: SimulationOutputSiteProductDetail
Internal Name: EndingInventoryUnits
Displays the inventory remaining at the site at the end of the simulation run.
Minimum Inventory Units
Table: SimulationOutputSiteProductDetail
Internal Name: MinimumInventoryUnits
Displays the lowest value that the inventory for this product at this site ever reached throughout the simulation run.
Maximum Inventory Units
Table: SimulationOutputSiteProductDetail
Internal Name: MaximumInventoryUnits
Displays the highest value that the inventory for this product at this site ever reached throughout the simulation run.
Average Back Order Units
Table: SimulationOutputSiteProductDetail
Internal Name: AverageBackOrderUnits
Displays the time-weighted average back ordered quantity due to downstream sites for this product at this site in the specified period:

where:
B = Backorder Quantity
T = Time
P = Total time in the period
n = change in B
Maximum Back Order Units
Table: SimulationOutputSiteProductDetail
Internal Name: MaximumBackOrderUnits
Displays the highest quantity of back ordered units due to downstream sites at any point of time for this product at this site in the specified period.
Average In Transit Units
Table: SimulationOutputSiteProductDetail
Internal Name: AverageInTransitUnits
Displays the time-weighted average of units in-transit from all sources for this site:

where:
C = Units in transit to the site
T = Time
P = Total time in the period
n = change in C
Maximum In Transit Units
Table: SimulationOutputSiteProductDetail
Internal Name: MaximumInTransitUnits
Displays the highest value that the in-transit inventory for this product at this site ever reached throughout the simulation run.
Inventory Velocity
Table: SimulationOutputSiteProductDetail
Internal Name: InventoryVelocity
Displays the time that inventory is held before delivery to the customer.
Average Replenishment Quantity
Table: SimulationOutputSiteProductDetail
Internal Name: AverageReplenishmentQuantity
Displays the time-weighted average of units received at this site from all sources:

where:
R = Units received
T = Time
P = Total time in the period
n = change in R
Period
Table: SimulationOutputSiteProductDetail
Internal Name: Period
Displays the period number for the summary values. ALL indicates the record for the complete model horizon.
Average Order Cycle Time
Table: SimulationOutputSiteProductDetail
Internal Name: AverageOrderCycleTime
Displays the average of order cycle times (in DAYS) by site and product in the specified period from all sources. Order cycle time is the difference between the time the entire order was filled and the Due Date. If the value is negative, this is a measure of how much more quickly the cycles are being fulfilled compared to when they are due. If the Due Date is not set, it is treated as the end of time (also known as year 100000). In this case the order cycle time will be 0.
Due dates for sites can only be set in the Shipments or Productions tables. Internal replenishment orders (those generated by inventory policies) have no due date and thus order cycle time will be 0.

where:
A = Final delivery date
D = Due Date
n = orders completely received
Maximum Order Cycle Time
Table: SimulationOutputSiteProductDetail
Internal Name: MaximumOrderCycleTime
Displays the highest cycle time from all sources by site and product in the specified period. See Average Order Cycle Time for more details.
On Time Rate
Table: SimulationOutputSiteProductDetail
Internal Name: OnTimeRate
Displays the ratio of orders successfully produced or received on time at this site versus all orders produced or received. If there is no due date, the order is counted as on time. See Average Order Cycle Time for more details on Due Date.
D/R
where:
D = Orders produced or received at this site before the Due Date.
R = Orders produced or received at this site.
On Time Qty Rate
Table: SimulationOutputSiteProductDetail
Internal Name: OnTimeQtyRate
Displays the ratio of units produced or received on time at this site versus all units produced or received. If there is no due date, the order is counted as on time. See Average Order Cycle Time for more details on Due Date.
Q/R
where:
Q = Quantity produced or received at this site before the Due Date.
R = Quantity produced or received at this site.
Cycle Service Level
Table: SimulationOutputSiteProductDetail
Internal Name: CycleServiceLevel
Displays the ratio of shipments received or productions finished (when inventory is greater than zero) versus all shipments received or productions finished. A high number suggests that receipts or productions finish before inventory goes to zero. A low number suggests that there are more times when inventory is zero, risking out-of-stock to downstream sites.
Z/R
where:
Z = Orders produced or received at this site when inventory > zero.
R = Orders produced or received at this site.
Fill Rate
Table: SimulationOutputSiteProductDetail
Internal Name: FillRate
Displays the ratio of downstream orders immediately and completely filled when initially processed at this site versus all downstream orders. A higher rate indicates sufficient inventory available on hand when orders arrive to completely fulfill orders. Details can be found in the Order Report.

where:
F = Downstream orders filled completely when initially processed
D = Count of downstream orders
Fill Qty Rate
Table: SimulationOutputSiteProductDetail
Internal Name: FillQtyRate
Displays the percentage of units immediately filled when initially processed at this site. A higher rate indicates sufficient inventory on hand to fully or partially fulfill orders. Details can be found in the Order Report:

where:
P = Downstream-ordered units filled when initially processed
D = Quantity ordered from downstream
Ready Rate
Table: SimulationOutputSiteProductDetail
Internal Name: ReadyRate
The percentage of some inventory available in any given period; that is the fraction of time with positive stock available to fill orders:

where:
ZT = Zero-inventory time
P = Time in the period
Ending Orders
Table: SimulationOutputSiteProductDetail
Internal Name: EndingOrders
Displays the number of outstanding upstream orders at the end of the period which have yet to be filled. A shipment that has not arrived is included in Ending Orders. An order partially filled will result in a percentage unfilled. For example, an original order for 10 has had 7 units filled but 3 are still waiting - Ending Orders will be 0.30.
Ending Order Qty
Table: SimulationOutputSiteProductDetail
Internal Name: EndingOrderQty
Displays the total number of outstanding upstream units at the end of the period which have yet to be filled.
Total Order Qty
Table: SimulationOutputSiteProductDetail
Internal Name: TotalOrderQty
Displays the total number of product units ordered upstream by this site during the specified period. This includes production orders at the site.
Ending Back Orders
Table: SimulationOutputSiteProductDetail
Internal Name: EndingBackOrders
Displays the number of downstream orders that are on back order at this site at the end of the specified period; that is, the number of orders that are unfulfilled for downstream locations.
Ending Back Order Qty
Table: SimulationOutputSiteProductDetail
Internal Name: EndingBackOrderQty
Displays the sum of downstream product units that are on back order at this site at the end of the specified period; that is, the number of units that are unfulfilled for downstream locations.
Total Back Order Qty
Table: SimulationOutputSiteProductDetail
Internal Name: TotalBackOrderQty
Displays the total number of back ordered product units in the specified period. These are the order units that cannot be fulfilled using inventory when the order is initially processed.
For example, a distribution center receives 5 orders of 10 units each from a customer. Throughout the modeling time, this DC has only 10 units of inventory with no replenishment; the Total Back Order Units at the DC is 40 units.
Total Downstream Demand
Table: SimulationOutputSiteProductDetail
Internal Name: TotalDownstreamDemand
Displays the total quantity ordered for this product at this site in the specified period.
Lost Downstream Demand
Table: SimulationOutputSiteProductDetail
Internal Name: LostDownstreamDemand
Displays the number of demand units that were canceled or lost during the specified period. Lost demand occurs when Allow Back Orders in the Site Sourcing Policies table is set to “No”. If a site is chosen through sourcing but the site cannot fill the order, the balance of the order is counted as lost demand. If the Allow Partial Fill flag is set to “Yes” for this site/product in the Inventory Policies table, the site will fill as much of the order as possible before sending the rest to Lost Downstream Demand. If the Allow Partial Fill flag is set to “No” in this situation, all ordered units are lost. Demand units can also be canceled if the Cancel If Late field is set to “Yes” in the Demand or Shipments tables. Any remaining balance on an order when the time of order processing is greater than the Due Date will be added to Lost Downstream Demand. This is a customer-facing metric only.
Lost Downstream Demand Revenue
Table: SimulationOutputSiteProductDetail
Internal Name: LostDownstreamDemandRevenue
Displays the lost revenue due to demand units that were canceled or lost during the specified period. See Lost Downstream Demand for more details.
Total Shipped Qty
Table: SimulationOutputSiteProductDetail
Internal Name: TotalShippedQty
Displays the number of units of this product shipped from this site.
Total Shipped Value
Table: SimulationOutputSiteProductDetail
Internal Name: TotalShippedValue
Displays the value of this product shipped from this site in the specified period.
Total Shipped Weight
Table: SimulationOutputSiteProductDetail
Internal Name: TotalShippedWeight
Displays the value of this product shipped from this site in the specified period.
Total Shipped Cubic
Table: SimulationOutputSiteProductDetail
Internal Name: TotalShippedCubic
Displays the cubic volume of this product shipped from this site in the specified period.
Total Orders
Table: SimulationOutputSiteProductDetail
Internal Name: TotalOrders
Displays the total number of orders for this product shipped from this site in the specified period.
Expired Units
Table: SimulationOutputSiteProductDetail
Internal Name: ExpiredUnits
Displays the number of product units that have expired at the site due to shelf life considerations. When you populate the Shelf Life column in the Products table, those products still at the site when the shelf life is reached will be expired.
Scenario ID
Table: SimulationOutputSiteProductDetail
Internal Name: ScenarioID
Displays the identifier of the scenario for which the summary data was generated.
Sub-Scenario ID
Table: SimulationOutputSiteProductDetail
Internal Name: StepNumber
Displays the identifier of the sub-scenario, if applicable, for which the summary data was generated.
Rep
Table: SimulationOutputSiteProductDetail
Internal Name: Rep
Displays the replication number that the data on this row applies to.
Last modified: Wednesday May 15, 2024