Site inventory costs
Distribution centers (DCs), consolidation points and plant warehouses are the general locations where products are held in the supply chain.

There are two main factors that affect the average inventory holding in a network:
- Volume of products flowing through site locations.
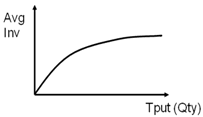
- Number of facilities in the network (as number of facilities decreases, average inventory at remaining facilities increases as a result of increased throughput). This phenomenon is often described as the "pooling" effect of inventory.

There are several ways to calculate average site inventory in an optimization model.
Using inventory turns to calculate average site inventory
Inventory turns represent how often products cycle through a warehouse. This can be thought of as the inverse of how long an item remains in inventory on average before it is removed from stock. Further, stepwise turns can be created, where the turns vary based on throughput level. This can be useful when capturing the pooling effect of increased throughput, leading to more turns.
You can enter turns in the Inventory Policies table for any site-product combination. If turns are set to zero, the site will not hold any turn-based inventory, and can therefore be set-up as a cross dock location.
Example: linear turns
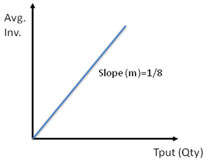
If the number of inventory turns is 8, then the following relationship is created:

As seen in this figure, the average inventory is proportional to the total throughput of the site:

Example: piecewise turns
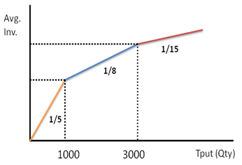
If the inventory turns vary with the throughput levels, where
the following relationship (as represented by the graph) is created:

This is a useful tool when the inventory turns vary with the throughput quantity for a site.
Last modified: Wednesday May 15, 2024
