Demand series propagation
Demand series-based demand propagation is intended to provide a more robust demand propagation by handling all kinds of demand data such as extremely slow and extremely small. Both formula and demand-series based demand propagation have advantage and disadvantages. For example, formula-based demand propagation cannot propagate extremely slow items demanded at the customer level (or any echelon in the network) to upstream levels. The following are a series of examples of demand propagation using the demand series method.
Example 1: No batch size (Q=1)
In the network illustrated below, Q=1 for each site. In this case, each site passes along the same demand that they face. The model start and end dates are 1/1/2015 and
1/11/2015, respectively.
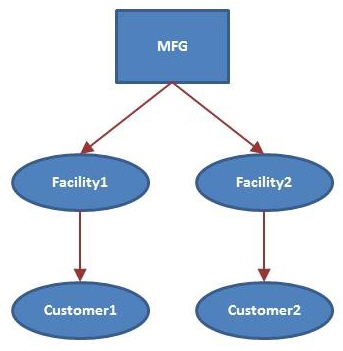
Each customer’s demand is shown in the following table:
| Site | Product | Order Time | Demand Quantity |
| Customer1 | Product1 | 1/2/2015 | 1 |
| Customer2 | Product1 | 1/2/2015 | 1 |
| Customer2 | Product1 | 1/5/2015 | 40 |
| Customer2 | Product1 | 1/6/2015 | 36 |
| Customer1 | Product1 | 1/7/2015 | 1 |
| Customer2 | Product1 | 1/7/2015 | 44 |
| Customer1 | Product1 | 1/10/2015 | 5 |
| Customer2 | Product1 | 1/10/2015 | 10 |
The orders placed at the MFG site are shown in the following table:
| Source Site | Destination Site | Product | Order Time | Demand Quantity |
| MFG | Site1 | Product1 | 1/2/2015 | 1 |
| MFG | Site2 | Product1 | 1/2/2015 | 1 |
| MFG | Site2 | Product1 | 1/5/2015 | 40 |
| MFG | Site2 | Product1 | 1/6/2015 | 36 |
| MFG | Site1 | Product1 | 1/7/2015 | 1 |
| MFG | Site2 | Product1 | 1/7/2015 | 44 |
| MFG | Site1 | Product1 | 1/10/2015 | 5 |
| MFG | Site2 | Product1 | 1/10/2015 | 10 |
Note that Site1 and Site2 create orders on the same day on 1/2/2015, 1/7/2015 and 1/10/2015. These orders are summed up when the demand information is created for the MFG site. In addition, demand of zero is recorded for the days where the facilities place no orders. The orders placed by each site create demand processes for the MFG site. The demand series at MFG is shown in the following table:
| Site | Product | Order Time | Demand Quantity |
| MFG | Product1 | 1/1/2015 | 0 |
| MFG | Product1 | 1/2/2015 | 2 |
| MFG | Product1 | 1/3/2015 | 0 |
| MFG | Product1 | 1/4/2015 | 0 |
| MFG | Product1 | 1/5/2015 | 40 |
| MFG | Product1 | 1/6/2015 | 36 |
| MFG | Product1 | 1/7/2015 | 45 |
| MFG | Product1 | 1/8/2015 | 0 |
| MFG | Product1 | 1/9/2015 | 0 |
| MFG | Product1 | 1/10/2015 | 15 |
| MFG | Product1 | 1/11/2015 | 0 |
The demand statistics are calculated using this demand series:
| Site | Product | Demand Mean | Demand Std Dev | Non-Zero Demand Mean | Non-Zero Demand Std Dev | Inter-Demand Interval Mean |
| MFG | Product1 | 12.55 | 18.49 | 27.60 | 18.31 | 1.67 |
Example 2: Batch ordering (Q>1)
This example uses the same network and customer demand as in Example 1. Assume that Q=10 for each site (this is interpreted as minimum order quantity). The model start and end dates are 1/1/2015 and 1/11/2015, respectively.
The orders placed at the MFG site are shown in the following table:
| Source Site | Destination Site | Product | Order Created Date | Original Order Quantity |
| MFG | Site1 | Product1 | 1/2/2015 | 10 |
| MFG | Site2 | Product1 | 1/2/2015 | 10 |
| MFG | Site2 | Product1 | 1/5/2015 | 40 |
| MFG | Site2 | Product1 | 1/6/2015 | 30 |
| MFG | Site1 | Product1 | 1/7/2015 | 50 |
| MFG | Site2 | Product1 | 1/10/2015 | 10 |
Notice that the facilities place orders of 10 or multiples of 10.
The orders placed by each site create demand processes for the MFG site. The demand series at MFG is shown in the following table:
| Site | Product | Order Time | Demand Quantity |
| MFG | Product1 | 1/1/2015 | 0 |
| MFG | Product1 | 1/2/2015 | 20 |
| MFG | Product1 | 1/3/2015 | 0 |
| MFG | Product1 | 1/4/2015 | 0 |
| MFG | Product1 | 1/5/2015 | 40 |
| MFG | Product1 | 1/6/2015 | 30 |
| MFG | Product1 | 1/7/2015 | 50 |
| MFG | Product1 | 1/8/2015 | 0 |
| MFG | Product1 | 1/9/2015 | 0 |
| MFG | Product1 | 1/10/2015 | 10 |
| MFG | Product1 | 1/11/2015 | 0 |
The demand statistics are calculated using this demand series:
| Site | Product | Demand Mean | Demand Std Dev | Non-Zero Demand Mean | Non-Zero Demand Std Dev | Inter-Demand Interval Mean |
| MFG | Product1 | 13.64 | 18.59 | 30.00 | 15.81 | 1.67 |
Example 3: Fractional sourcing
In this example, the network uses the fractional sourcing structure shown below:
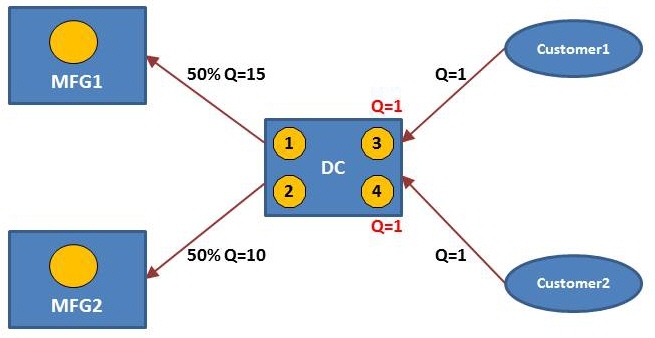
Customers place orders to the DC with Q=1. The fractional sourcing parameter at the DC is given as 50%. The DC places orders to MFG1 with Q=15 and orders to MFG2 with Q=10. The customer orders are:
| Customer1 (Q=1): | 60, | 0, | 10, | 40, | 0, | 0, | 50, | 0 |
| Customer2 (Q=1): | 10, | 20, | 0, | 0, | 10, | 0, | 0, | 30 |
The customer orders create the following demand series at the DC:
| DC (merged): | 70, | 20, | 10, | 40, | 10, | 0, | 50, | 30 |
The intermediate demand series (not reported) that is propagated to each MFG uses the fractional sourcing parameters. In this case, both MFG sites use a sourcing parameter of 50%.
| DC (merged) 50%: | 35, | 10, | 5, | 20, | 5 | 0, | 25, | 15 |
Based on the minimum order quantity (Q), the demand series is propagated to MFG1 and MFG2 as follows:
| MFG1 (Q=15): | 45, | 0, | 15, | 15, | 0, | 0, | 30, | 15 |
| MFG2 (Q=10): | 40, | 10, | 0, | 20, | 10, | 0, | 20, | 20 |
Example 4: Bills of material (BOM)
In this example, the network uses the bills of material (BOM) structure shown below:
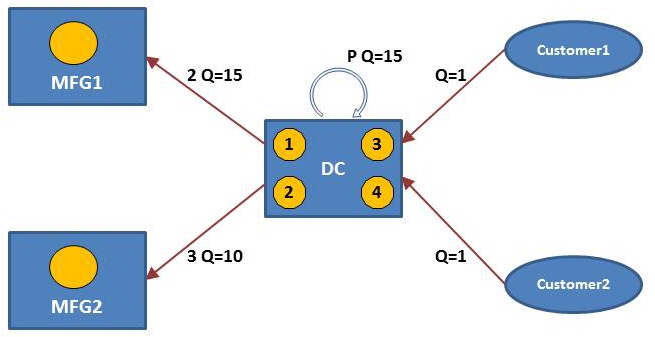
Customers place orders to the DC with Q=1. There is assembly production at the DC with Q=15 to create the finished good. The bills of material parameters at the DC are:
P=(2 * Component1 + 3 * Component2)
Component1 is produced at MFG1 and Component2 is produced at MFG2. The DC places orders to MFG1 with Q=15 and order to MFG2 with Q=10. The customer orders are:
| Customer1 (Q=1): | 60, | 0, | 10, | 40, | 0, | 0, | 50, | 0 |
| Customer2 (Q=1): | 10, | 20, | 0, | 0, | 10, | 0, | 0, | 30 |
The customer orders create the following demand series at the DC:
| DC (merged): | 70, | 20, | 10, | 40, | 10, | 0, | 50, | 30 |
The intermediate demand series (not reported) that is propagated to the DC itself is determined by production using Q=15.
| DC/P (Q=15): | 75, | 15, | 15, | 45, | 0 | 0, | 60, | 30 |
The BOM coefficients are applied to create the other intermediate demand series (not reported) for each component:
| DC/P * 2: | 150, | 30, | 30, | 90, | 0, | 0, | 120, | 60 |
| DC/P * 3: | 225, | 45, | 45, | 135, | 0, | 0, | 180, | 90 |
Finally, these demand series are propagated to the MFG sites using Q=15 for MFG1 and Q=10 for MFG2:
| MFG1 (Q=15): | 150, | 30, | 30, | 90, | 0, | 0, | 120, | 60 |
| MFG2 (Q=10): | 230, | 40, | 50, | 130, | 0, | 0, | 180, | 90 |
Example 5: Replenishment frequency
The main assumption with demand propagation is that each site operates under a continuous review policy (r, nq). Each site may place a replenishment order at any time. However, some sites may want to order at specific intervals. You can use Replenishment Frequency as an input to demand series-based demand propagation. Assume the network structure shown below, where Replenishment Frequency is set to 3 day for the DC. This setup means that the DC places orders to the MFG site every 3 days. In addition, the minimum order quantity is 50:

The customer orders create the following demand series at the DC:
| Customer (Q=1): | 60, | 0, | 10, | 40, | 0, | 0, | 0, | 0 |
|
DC (Q=50 Replenishment Frequency=3:) |
0, | 0, | 100, | 0, | 0, | 50, | 0, | 0 |
You can use the demand series-based demand propagation method only when demand series are available. If the demand series is not available (or missing for some customers), then the demand propagation is switched to formula-based demand propagation. If demand series are available at the customer level, then demand propagation will apply demand series-based demand propagation regardless of the selected method. The following examples illustrate these cases.
Case 1: User Defined Customer Forecast Profile and Customer Demand table are populated:
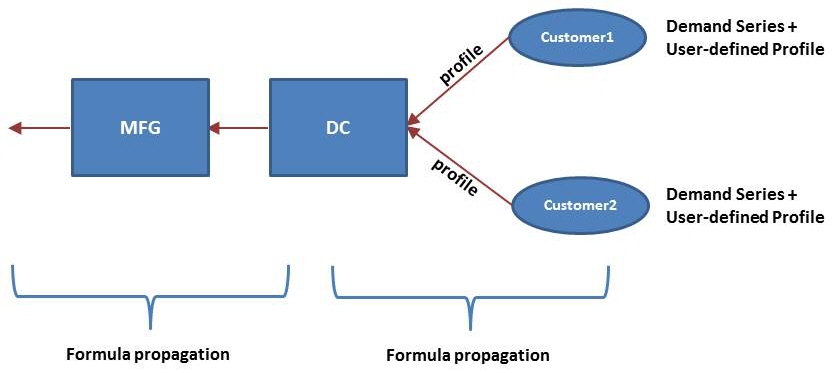
In this case, demand series are ignored. In this case, demand series are ignored. Each user defined profile must have the required 5 parameters. If you only enter the Forecast Mean and Forecast Error, the demand propagation is performed in a different way.
Case 2: Demand series-demand propagation method is applied if demand series are available at the customer level, regardless of the selected propagation method:
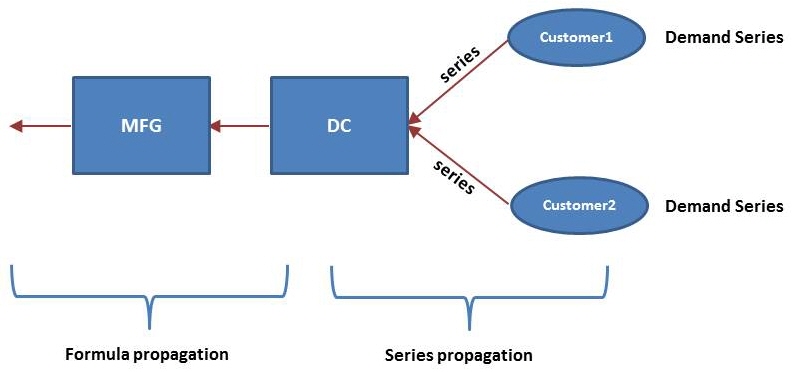
When the demand series are available at the customer level, demand series-based propagation is applied from customers to the DC even if you select the formula-based demand propagation method.
Case 3: Demand series is missing at a customer level:
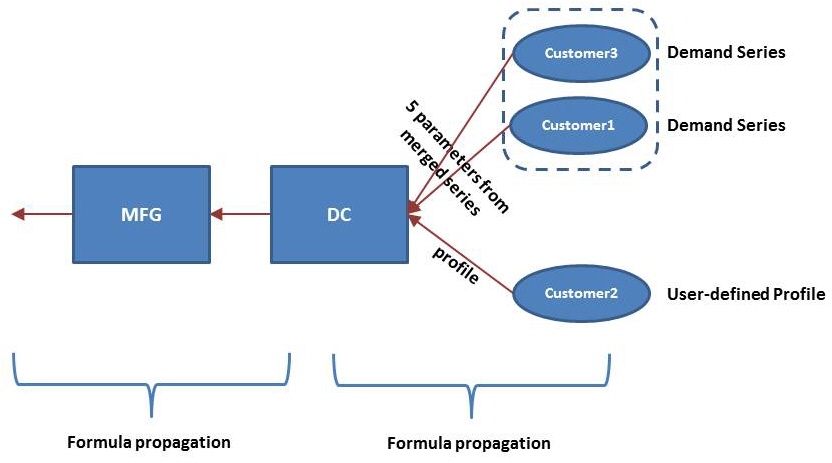
Notice that the demand series is not available for Customer2. Demand statistics for this customer are provided in the User Defined Customer Forecast Profile table. The demand propagation is automatically switched to formula-based and applied across the entire network.
Case 4: Demand series is not available at a customer that places orders to a higher echelon:
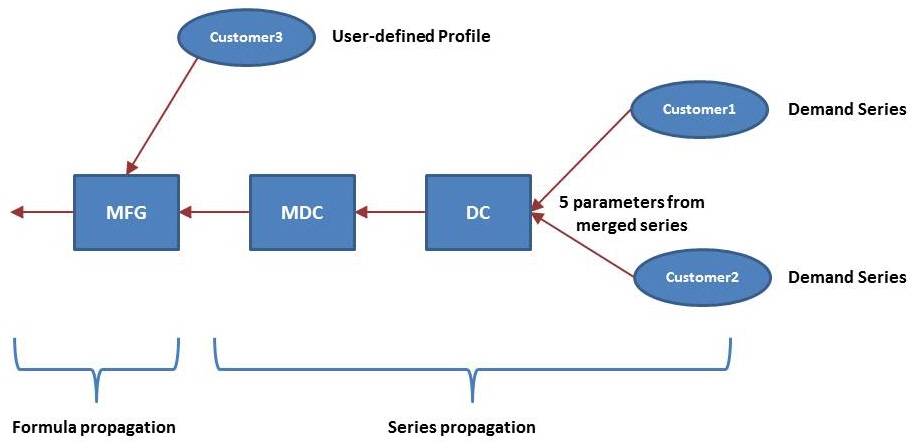
Assume that demand series-based demand propagation is selected. The demand information for Customer3 is available as demand statistics in the user defined forecast profile table. In this case, Demand Analysis performs demand series-based demand propagation from the customers to the MFG. From the MFG to upstream echelons, demand propagation is switched to formula-based demand propagation.
Last modified: Wednesday May 15, 2024
