Sample demand data and life cycle summary
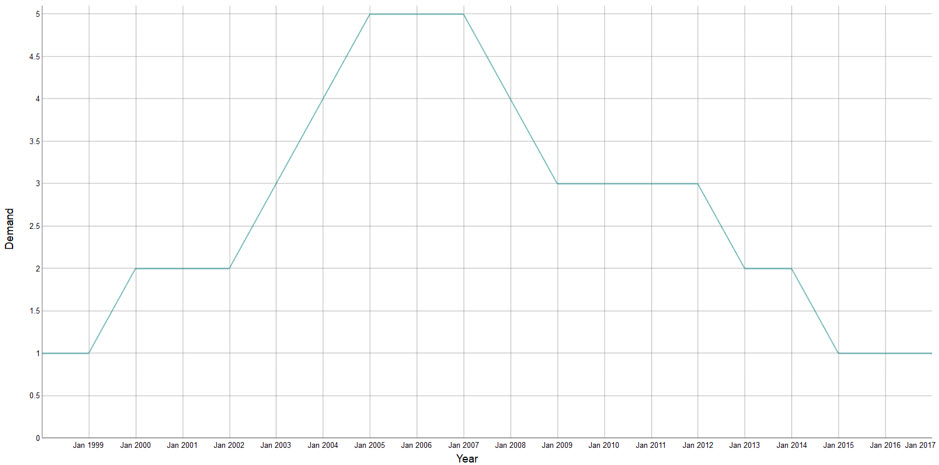
Assume that you are given a yearly demand data stream between 1998 – 2017:
| Date | Demand |
|---|---|
| 1/1/1998 | 1 |
| 1/1/1999 | 1 |
| 1/1/2000 | 2 |
| 1/1/2001 | 2 |
| 1/1/2002 | 2 |
| 1/1/2003 | 3 |
| 1/1/2004 | 4 |
| 1/1/2005 | 5 |
| 1/1/2006 | 5 |
| 1/1/2007 | 5 |
| 1/1/2008 | 4 |
| 1/1/2009 | 3 |
| 1/1/2010 | 3 |
| 1/1/2011 | 3 |
| 1/1/2012 | 3 |
| 1/1/2013 | 2 |
| 1/1/2014 | 2 |
| 1/1/2015 | 1 |
| 1/1/2016 | 1 |
| 1/1/2017 | 1 |
The demand time series plot is shown as:
The cumulative demand stream is then used to fit a model:
| Date | Demand | Cumulative Demand |
|---|---|---|
| 1/1/1998 | 1 | 1 |
| 1/1/1999 | 1 | 2 |
| 1/1/2000 | 2 | 4 |
| 1/1/2001 | 2 | 6 |
| 1/1/2002 | 2 | 8 |
| 1/1/2003 | 3 | 11 |
| 1/1/2004 | 4 | 15 |
| 1/1/2005 | 5 | 20 |
| 1/1/2006 | 5 | 25 |
| 1/1/2007 | 5 | 30 |
| 1/1/2008 | 4 | 34 |
| 1/1/2009 | 3 | 37 |
| 1/1/2010 | 3 | 40 |
| 1/1/2011 | 3 | 43 |
| 1/1/2012 | 3 | 46 |
| 1/1/2013 | 2 | 48 |
| 1/1/2014 | 2 | 50 |
| 1/1/2015 | 1 | 51 |
| 1/1/2016 | 1 | 52 |
| 1/1/2017 | 1 | 53 |
In this example, the Richards model is used to fit the given data. The model estimates the maximum growth value (A) as 55.9. In addition, the model is used to project the predictions for the next 10 years.
The fitted and predicted cumulative demand values are shown as:
| Date | Demand | Cumulative Demand | Fitted Cumulative Demand |
|---|---|---|---|
| 1/1/1998 | 1 | 1 | 1.2 |
| 1/1/1999 | 1 | 2 | 2.1 |
| 1/1/2000 | 2 | 4 | 3.4 |
| 1/1/2001 | 2 | 6 | 5.5 |
| 1/1/2002 | 2 | 8 | 8.2 |
| 1/1/2003 | 3 | 11 | 11.6 |
| 1/1/2004 | 4 | 15 | 15.6 |
| 1/1/2005 | 5 | 20 | 20.1 |
| 1/1/2006 | 5 | 25 | 24.6 |
| 1/1/2007 | 5 | 30 | 29.1 |
| 1/1/2008 | 4 | 34 | 33.4 |
| 1/1/2009 | 3 | 37 | 37.3 |
| 1/1/2010 | 3 | 40 | 40.6 |
| 1/1/2011 | 3 | 43 | 43.6 |
| 1/1/2012 | 3 | 46 | 46.0 |
| 1/1/2013 | 2 | 48 | 48.0 |
| 1/1/2014 | 2 | 50 | 49.7 |
| 1/1/2015 | 1 | 51 | 51.0 |
| 1/1/2016 | 1 | 52 | 52.0 |
| 1/1/2017 | 1 | 53 | 52.9 |
| 1/1/2018 | 53.6 | ||
| 1/1/2019 | 54.1 | ||
| 1/1/2020 | 54.5 | ||
| 1/1/2021 | 54.8 | ||
| 1/1/2022 | 55.1 | ||
| 1/1/2023 | 55.3 | ||
| 1/1/2024 | 55.4 | ||
| 1/1/2025 | 55.5 | ||
| 1/1/2026 | 55.6 | ||
| 1/1/2027 | 55.7 |
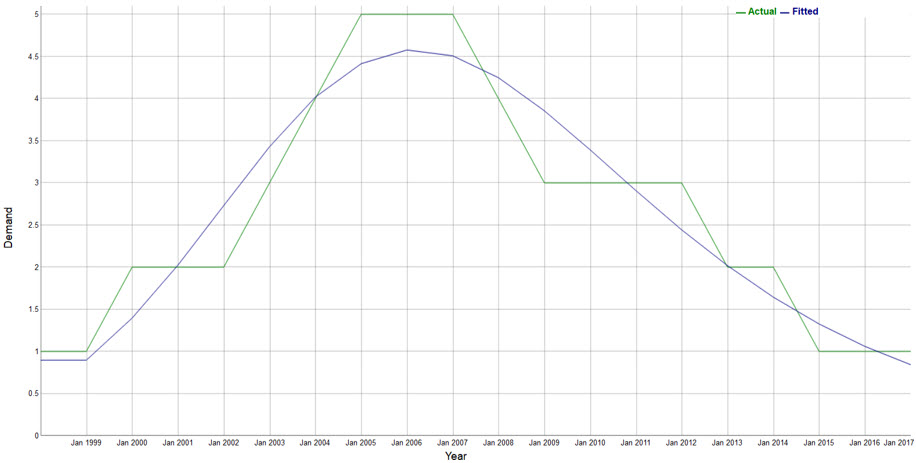
The fitted and predicted demand values can be extracted from the fitted cumulative demand:
| Date | Demand | Cumulative Demand | Fitted Cumulative Demand | Fitted Demand |
|---|---|---|---|---|
| 1/1/1998 | 1 | 1 | 1.2 | NA |
| 1/1/1999 | 1 | 2 | 2.1 | 0.9 |
| 1/1/2000 | 2 | 4 | 3.4 | 1.4 |
| 1/1/2001 | 2 | 6 | 5.5 | 2.0 |
| 1/1/2002 | 2 | 8 | 8.2 | 2.7 |
| 1/1/2003 | 3 | 11 | 11.6 | 3.4 |
| 1/1/2004 | 4 | 15 | 15.6 | 4.0 |
| 1/1/2005 | 5 | 20 | 20.1 | 4.4 |
| 1/1/2006 | 5 | 25 | 24.6 | 4.6 |
| 1/1/2007 | 5 | 30 | 29.1 | 4.5 |
| 1/1/2008 | 4 | 34 | 33.4 | 4.2 |
| 1/1/2009 | 3 | 37 | 37.3 | 3.9 |
| 1/1/2010 | 3 | 40 | 40.6 | 3.4 |
| 1/1/2011 | 3 | 43 | 43.6 | 2.9 |
| 1/1/2012 | 3 | 46 | 46.0 | 2.4 |
| 1/1/2013 | 2 | 48 | 48.0 | 2.0 |
| 1/1/2014 | 2 | 50 | 49.7 | 1.6 |
| 1/1/2015 | 1 | 51 | 51.0 | 1.3 |
| 1/1/2016 | 1 | 52 | 52.0 | 1.1 |
| 1/1/2017 | 1 | 53 | 52.9 | 0.8 |
| 1/1/2018 | 53.6 | 0.7 | ||
| 1/1/2019 | 54.1 | 0.5 | ||
| 1/1/2020 | 54.5 | 0.4 | ||
| 1/1/2021 | 54.8 | 0.3 | ||
| 1/1/2022 | 55.1 | 0.3 | ||
| 1/1/2023 | 55.3 | 0.2 | ||
| 1/1/2024 | 55.4 | 0.2 | ||
| 1/1/2025 | 55.5 | 0.1 | ||
| 1/1/2026 | 55.6 | 0.1 | ||
| 1/1/2027 | 55.7 | 0.1 |
The actual and fitted demand plot is shown as:
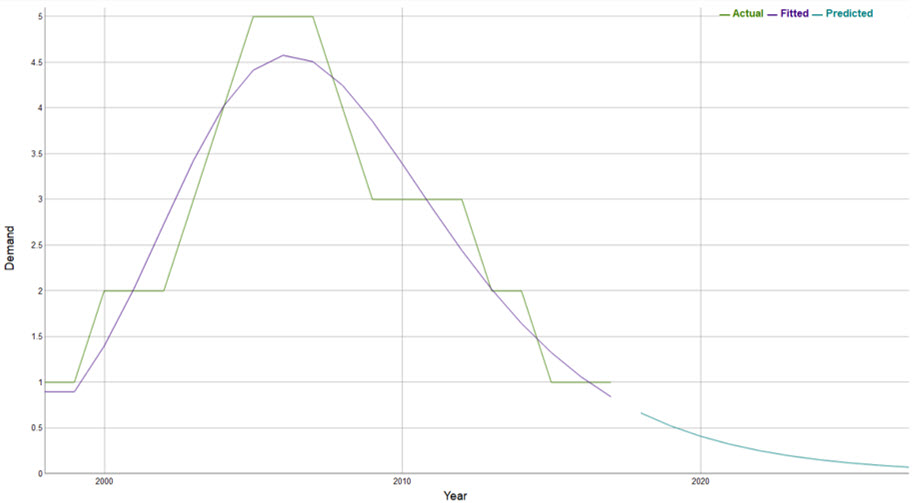
The actual and fitted demand plot, combined with the predicted demand plot, is shown as:
Fitted growth rate values are estimated as the ratio between fitted demand value over maximum growth value:
| Date | Demand | Cumulative Demand | Fitted Cumulative Demand | Fitted Demand | Fitted Growth Rate |
|---|---|---|---|---|---|
| 1/1/1998 | 1 | 1 | 1.2 | NA | NA |
| 1/1/1999 | 1 | 2 | 2.1 | 0.9 | 0.90% |
| 1/1/2000 | 2 | 4 | 3.4 | 1.4 | 1.40% |
| 1/1/2001 | 2 | 6 | 5.5 | 2.0 | 2.02% |
| 1/1/2002 | 2 | 8 | 8.2 | 2.7 | 2.73% |
| 1/1/2003 | 3 | 11 | 11.6 | 3.4 | 3.43% |
| 1/1/2004 | 4 | 15 | 15.6 | 4.0 | 4.02% |
| 1/1/2005 | 5 | 20 | 20.1 | 4.4 | 4.41% |
| 1/1/2006 | 5 | 25 | 24.6 | 4.6 | 4.58% |
| 1/1/2007 | 5 | 30 | 29.1 | 4.5 | 4.51% |
| 1/1/2008 | 4 | 34 | 33.4 | 4.2 | 4.25% |
| 1/1/2009 | 3 | 37 | 37.3 | 3.9 | 3.86% |
| 1/1/2010 | 3 | 40 | 40.6 | 3.4 | 3.39% |
| 1/1/2011 | 3 | 43 | 43.6 | 2.9 | 2.91% |
| 1/1/2012 | 3 | 46 | 46.0 | 2.4 | 2.44% |
| 1/1/2013 | 2 | 48 | 48.0 | 2.0 | 2.02% |
| 1/1/2014 | 2 | 50 | 49.7 | 1.6 | 1.64% |
| 1/1/2015 | 1 | 51 | 51.0 | 1.3 | 1.33% |
| 1/1/2016 | 1 | 52 | 52.0 | 1.1 | 1.06% |
| 1/1/2017 | 1 | 53 | 52.9 | 0.8 | 0.84% |
| 1/1/2018 | 53.6 | 0.7 | 0.67% | ||
| 1/1/2019 | 54.1 | 0.5 | 0.52% | ||
| 1/1/2020 | 54.5 | 0.4 | 0.41% | ||
| 1/1/2021 | 54.8 | 0.3 | 0.32% | ||
| 1/1/2022 | 55.1 | 0.3 | 0.25% | ||
| 1/1/2023 | 55.3 | 0.2 | 0.20% | ||
| 1/1/2024 | 55.4 | 0.2 | 0.15% | ||
| 1/1/2025 | 55.5 | 0.1 | 0.12% | ||
| 1/1/2026 | 55.6 | 0.1 | 0.09% | ||
| 1/1/2027 | 55.7 | 0.1 | 0.07% |
This stream is useful for observing how the growth rate changes over time. It is also used to determine the half-life of a product.
Cumulative growth percentages are another important stream, and they are calculated as the fitted cumulative demand over max growth.
| Date | Demand | Cumulative Demand |
Fitted Cumulative Demand |
Fitted Demand | Fitted Growth Rate | Cumulative Growth Percentages |
|---|---|---|---|---|---|---|
| 1/1/1998 | 1 | 1 | 1.2 | NA | NA | 2.07% |
| 1/1/1999 | 1 | 2 | 2.1 | 0.9 | 0.90% | 3.67% |
| 1/1/2000 | 2 | 4 | 3.4 | 1.4 | 1.40% | 6.16% |
| 1/1/2001 | 2 | 6 | 5.5 | 2.0 | 2.02% | 9.78% |
| 1/1/2002 | 2 | 8 | 8.2 | 2.7 | 2.73% | 14.66% |
| 1/1/2003 | 3 | 11 | 11.6 | 3.4 | 3.43% | 20.79% |
| 1/1/2004 | 4 | 15 | 15.6 | 4.0 | 4.02% | 27.97% |
| 1/1/2005 | 5 | 20 | 20.1 | 4.4 | 4.41% | 35.87% |
| 1/1/2006 | 5 | 25 | 24.6 | 4.6 | 4.58% | 44.05% |
| 1/1/2007 | 5 | 30 | 29.1 | 4.5 | 4.51% | 52.10% |
| 1/1/2008 | 4 | 34 | 33.4 | 4.2 | 4.25% | 59.70% |
| 1/1/2009 | 3 | 37 | 37.3 | 3.9 | 3.86% | 66.59% |
| 1/1/2010 | 3 | 40 | 40.6 | 3.4 | 3.39% | 72.65% |
| 1/1/2011 | 3 | 43 | 43.6 | 2.9 | 2.91% | 77.85% |
| 1/1/2012 | 3 | 46 | 46.0 | 2.4 | 2.44% | 82.22% |
| 1/1/2013 | 2 | 48 | 48.0 | 2.0 | 2.02% | 85.83% |
| 1/1/2014 | 2 | 50 | 49.7 | 1.6 | 1.64% | 88.77% |
| 1/1/2015 | 1 | 51 | 51.0 | 1.3 | 1.33% | 91.14% |
| 1/1/2016 | 1 | 52 | 52.0 | 1.1 | 1.06% | 93.03% |
| 1/1/2017 | 1 | 53 | 52.9 | 0.8 | 0.84% | 94.54% |
| 1/1/2018 | 53.6 | 0.7 | 0.67% | 95.73% | ||
| 1/1/2019 | 54.1 | 0.5 | 0.52% | 96.66% | ||
| 1/1/2020 | 54.5 | 0.4 | 0.41% | 97.40% | ||
| 1/1/2021 | 54.8 | 0.3 | 0.32% | 97.97% | ||
| 1/1/2022 | 55.1 | 0.3 | 0.25% | 98.42% | ||
| 1/1/2023 | 55.3 | 0.2 | 0.20% | 98.77% | ||
| 1/1/2024 | 55.4 | 0.2 | 0.15% | 99.05% | ||
| 1/1/2025 | 55.5 | 0.1 | 0.12% | 99.26% | ||
| 1/1/2026 | 55.6 | 0.1 | 0.09% | 99.42% | ||
| 1/1/2027 | 55.7 | 0.1 | 0.07% | 99.55% |
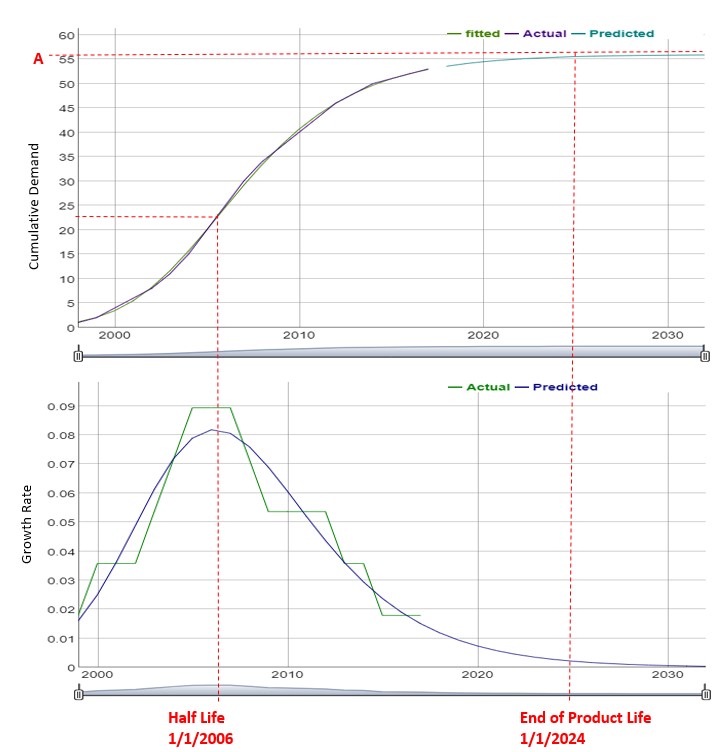
Demand Guru uses the stream that ranges from 0-99%, which allows it to predict product life, half product life, half product growth, and life cycle stages. Eventually, it converges to 1. Demand Guru assumes that immediately after 99% of cumulative growth percentage, the product dies.
In this example, the product’s half-life 9 years in 2006, which is the point at which the growth rate starts to decline. The product life is estimated at 27 years, which in this case lasts until the end of year 2024. The total cumulative growth in the half-life is estimated at 24.6. Max growth, half-life, and product life are depicted in the following plot:
The product stage is determined as:
- Launch if cumulative growth percentage < 5%
- Growth if 5% <= cumulative growth percentage < 40%
- Maturity if 40% <= cumulative growth percentage < 60%
- Decline if 60% <= cumulative growth percentage < 95%
- Obsolescence if cumulative growth percentage > 95%
In this example, at the end of the actual demand stream, the cumulative growth percentage is estimated as 94.5%. In other words, 94.5% of the total sales has been realized. Therefore, the product is currently in the Decline stage. Current stage analysis may show the impact of introducing a new product on existing products; some products can be in Growth stage while other products are in Decline or Obsolescence stages. This analysis can help managers visualize which products are in the Decline or Obsolescence stages, and can be used to determine when to introduce new products (depending on the current stage of existing products).
The estimated life cycle stages can be given in the following table.
| Date | Demand | Cumulative Demand |
Fitted Cumulative Demand |
Fitted Demand | Fitted Growth Rate | Cumulative Growth Percentages | Life Cycle Stages |
|---|---|---|---|---|---|---|---|
| 1/1/1998 | 1 | 1 | 1.2 | NA | NA | 2.07% | Launch |
| 1/1/1999 | 1 | 2 | 2.1 | 0.9 | 1.6% | 3.67% | :Launch |
| 1/1/2000 | 2 | 4 | 3.4 | 1.4 | 2.5% | 6.16% | Growth |
| 1/1/2001 | 2 | 6 | 5.5 | 2.0 | 3.6% | 9.78% | Growth |
| 1/1/2002 | 2 | 8 | 8.2 | 2.7 | 4.9% | 14.66% | Growth |
| 1/1/2003 | 3 | 11 | 11.6 | 3.4 | 6.1% | 20.79% | Growth |
| 1/1/2004 | 4 | 15 | 15.6 | 4.0 | 7.2% | 27.97% | Growth |
| 1/1/2005 | 5 | 20 | 20.1 | 4.4 | 7.9% | 35.87% | Growth |
| 1/1/2006 | 5 | 25 | 24.6 | 4.6 | 8.2% | 44.05% | Maturity |
| 1/1/2007 | 5 | 30 | 29.1 | 4.5 | 8.1% | 52.10% | Maturity |
| 1/1/2008 | 4 | 34 | 33.4 | 4.2 | 7.6% | 59.70% | Maturity |
| 1/1/2009 | 3 | 37 | 37.3 | 3.9 | 6.9% | 66.59% | Decline |
| 1/1/2010 | 3 | 40 | 40.6 | 3.4 | 6.1% | 72.65% | Decline |
| 1/1/2011 | 3 | 43 | 43.6 | 2.9 | 5.2% | 77.85% | Decline |
| 1/1/2012 | 3 | 46 | 46.0 | 2.4 | 4.4% | 82.22% | Decline |
| 1/1/2013 | 2 | 48 | 48.0 | 2.0 | 3.6% | 85.83% | Decline |
| 1/1/2014 | 2 | 50 | 49.7 | 1.6 | 2.9% | 88.77% | Decline |
| 1/1/2015 | 1 | 51 | 51.0 | 1.3 | 2.4% | 91.14% | Decline |
| 1/1/2016 | 1 | 52 | 52.0 | 1.1 | 1.9% | 93.03% | Decline |
| 1/1/2017 | 1 | 53 | 52.9 | 0.8 | 1.5% | 94.54% | Decline |
| 1/1/2018 | 53.6 | 0.7 | 1.2% | 95.73% | Obsolescence | ||
| 1/1/2019 | 54.1 | 0.5 | 0.9% | 96.66% | Obsolescence | ||
| 1/1/2020 | 54.5 | 0.4 | 0.7% | 97.40% | Obsolescence | ||
| 1/1/2021 | 54.8 | 0.3 | 0.6% | 97.97% | Obsolescence | ||
| 1/1/2022 | 55.1 | 0.3 | 0.4% | 98.42% | Obsolescence | ||
| 1/1/2023 | 55.3 | 0.2 | 0.4% | 98.77% | Obsolescence | ||
| 1/1/2024 | 55.4 | 0.2 | 0.3% | 99.05% | Obsolescence | ||
| 1/1/2025 | 55.5 | 0.1 | 0.2% | 99.26% | Obsolescence | ||
| 1/1/2026 | 55.6 | 0.1 | 0.2% | 99.42% | Obsolescence | ||
| 1/1/2027 | 55.7 | 0.1 | 0.1% | 99.55% | Obsolescence |
Last modified: Thursday December 19, 2024