Demand lags
Demand data in time series format is sequential in nature, resulting in observed behaviors that often are dependent on each other. For example, if demand for milk in a grocery store is high on a given day, its demand on the next day might be expected to go down because most regular customers have already bought their milk. In this case, demand of the product today “guides” us to predict tomorrow’s demand. Similarly, demand realized the previous Monday can help predict demand on the following Monday, demand from last month can help predict the next month's demand, and so on.
In Demand Guru, this type of dependence between demand values is captured through the Demand Lags algorithm-generated causal. The lags are numbered consecutively, beginning with 1 for the previous time period and increasing that number while moving backward through previous periods. For example, demand_lag_1 refers to the previous period, demand_lag_2 refers to the period prior to that, and so on.
The algorithm tests these lags to determine their importance to a given time series. If demand_lag_1 is deemed important, that means demand in the previous period helps predict the current demand. Similarly, if demand_lag_4 is deemed important, that means demand realized 4 periods ago helps predict the current demand.
The period can be a day, week, month, quarter, or year depending on the aggregation level. If the time aggregation level is set to weekly, then demand_lag_5 refers to demand that occurred 5 weeks ago and is affecting this week's demand; for monthly aggregation, demand_lag_5 refers to demand that occurred 5 months ago and is affecting this month’s demand.
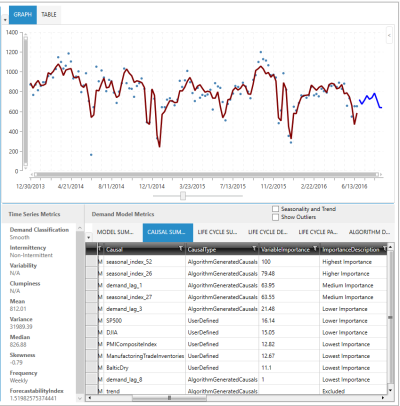
The following example shows a demand time series for which Demand Guru has identified three demand lags to be important:
The demand lags identified are:
- demand_lag_1
- demand_lag_3
- demand_lag_8
Although all three of the lags are considered important, the VariableImportance column in the Causal Summary table shows that their importance scores vary noticeably:
- demand_lag_1 is the most important lag, with a score of 63.95
- demand_lag_3 shows a score of 21.48
- demand_lag_8 is the least important lag, with a score of 1
Demand lags can have a positive or negative correlation with the demand signal. For daily milk demand in a grocery store, if yesterday’s high demand means today’s demand will be reduced, then demand_lag_1 is negatively correlated with the demand signal. On the other hand, if high demand for ice cream last Saturday helps predict high demand for ice cream next Saturday, then demand_lag_1 is positively correlated with the demand signal. The directionality of demand lag correlation is noted in the CorrelationWithDemand column of the Causal Summary table.
Last modified: Thursday December 19, 2024

