Time series metrics
Time series metrics highlight specific characteristics of the demand, and they are available when you click Generate Time Series Only on the Definition tab of the Workbench.
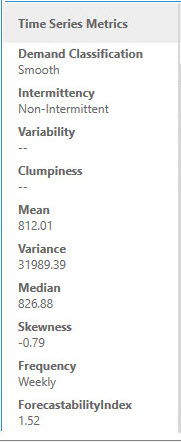
Demand Classification
Defines demand as one of four main categories. Intermittency and demand variability in relation to its mean are used to differentiate the demand classes.
- Smooth – Non-Intermittent demand with low variability compared to its mean.
- Erratic – Non-Intermittent demand with higher variability compared to its mean.
- Slow – Intermittent demand with low variability compared to its mean.
- Lumpy – Intermittent demand with higher variability compared to its mean.
- Extremely Slow - Demand time series having less than three non-zero demand points.
- Unclassified - Demand classification cannot identify any demand class for the provided time series.
Intermittency
Determines the frequency of demand using the average time between adjacent positive demand points.
- Non-Intermittent – Average time between demand is less than the Intermittency Threshold.
- Intermittent – Average time between demand is at or greater than the Intermittency Threshold.
Variability
Indicates how much demand is varying based on Non-Zero Demand Variability.
- Low-Variable – Demand is reasonably constant or fluctuating within a small range.
- Highly-Variable – Demand is significantly different from one demand point to another.
This field only applies to Intermittent demand and is blank for Non-Intermittent demand.
Clumpiness
Further defines Low-Variable Slow demand. Clumpiness indicates how close demand points are to each other. Clumped demand has reasonably constant demand, with variability close to zero. Unit-Sized demand has no variability, and demand size is always 1.
Mean
Average demand per period for the time series.
Variance
Variance of the demand of a specific time series.
Median
It is the 50th percentile of the demand for a specific time series.
Skewness
Skewness highlights how symmetric the demand is with respect to its mean. A positive skewness indicates that that the demand has heavier tail to the right (more likely to observe values greater than the mean demand) while a negative skewness indicates the latter (more likely to observe values lesser than the mean demand).
Frequency
Indicates the aggregation level of the time series at which the analysis was performed.
Forecastability Index
Measures the degree of randomness in a specific time series. It indicates how easy it is to forecast the time series. The lower the index, the better the ability to forecast with simple algorithms; conversely, a higher index indicates that the time series is difficult to forecast.
Last modified: Thursday December 19, 2024