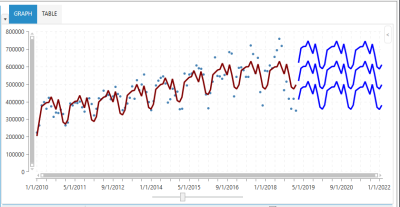
Prediction intervals
Prediction interval is a band (interval) that likely contains the true demand value of a single new observation, with a specified degree of confidence and for given values of independent variables.
In Demand Guru, algorithms report prediction intervals at a 95% confidence level. In other words, for any given prediction, there is a 95% chance that the corresponding true demand will lie somewhere in the prediction interval surrounded by it.
Currently, the following time series forecasting algorithms in Demand Guru report prediction intervals along with mean predictions:
- Arima
- Arimax
- Auto Arima
- Exponential Smoothing
- Naïve Forecasting
- Quantile Random Forest
- Simple Moving Average
Prediction Intervals Calculations
Prediction Intervals are calculated using the following formula:
where -
-
 is the predicted value of demand when the independent variable is
  .
. -
 is the “t-multiplier.” The t-multiplier has n-2 degrees of freedom, because the prediction interval uses the Mean Square Error (MSE) with a denominator of n-2.
 -
 is the “standard error of the prediction.”
Prediction intervals are based on a strong assumption that errors are normally distributed.
The Quantile Random Forest algorithm calculates prediction intervals a little differently. Instead of storing the mean value of demand in each leaf node of a decision tree, this algorithm stores all observed demand values in the leaf. Instead of returning just the mean demand, the prediction returns the full conditional distribution of demand for every observed value of independent variables. The 95% prediction intervals are then calculated as a range between 2.5 and 97.5 percentile of the distribution of demand in the leaves. The necessary averages are then taken across multiple decision tree leaves to calculate output of the random forest.
Prediction interval and confidence interval are not the same
While prediction interval represents a band around a single new observation, confidence interval represents a band around an estimate of the mean predicted value for given values of independent variables. Thus, one is a prediction of a future observation, and the other is a prediction of mean response. The prediction interval band is always wider (less certain) than the confidence interval band for the same predictive model.
Prediction interval references
https://newonlinecourses.science.psu.edu/stat501/
https://blog.datadive.net/prediction-intervals-for-random-forests/
Last modified: Thursday December 19, 2024


