Remove obsolete data and identify sites holding excessive inventory
Data Guru allows you to filter data using a filter expression in almost any transform action. Three of the most common actions used for filtering data are:
- Select
- Delete Rows
- Data Fork
This example demonstrates filtering inventory, product, and site data to view only active products, update a site master table, and identify periods in which a site is holding over 3 million dollars of inventory of a single product.
The data available for this example is an Excel workbook with three Excel worksheets: Inventory Snapshot, Products, and Site Master.
- The Inventory Snapshot table shows monthly inventory levels and inventory carrying cost for each site-product combination.
- a unique site ID (field name is Site, which maps to the SiteMaster field Site)
- a product name (field name is Product, which maps to ProductMaster Product)
- Inventory columns per period (field names are formatted M_DD_YYYY)
- The ProductMaster table contains a master list of all products with a few description columns, including the products’ status. We will filter out obsolete products in the project. This table includes -
- Product description (field name is Product, which maps to the Inventory Snapshot Product)
- Product Sub-Family
- Product Family
- Unit Cost (field name Unit Cost)
- Unit Sales Price
- Status (field name is Status)
- The SiteMaster table shows the list of distribution centers including their location. When importing the table is renamed to Site_Input. This table includes -
- Site (field name is Site, which maps to the Inventory Snapshot Site)
- Site City
- Site Country
Once the tables are imported, you can manipulate the data.
Step 1 – Use the Unpivot action to unpivot the inventory data. It is bad practice to store the same type of data in different columns, as is occurring in this table with the inventory values for each month are stored in separate columns. You need to unpivot the data to put it in a normalized format, with one column for the date and another for the inventory quantity.
- Specify the output column name for the headers as Date.
- Specify the output column name for the inventory data as InvQuantity.
- Select the Pass Through box for the Site, Product, and Carrying Cost % columns. These will be columns in the new table.
- Select the Pivot box for each monthly inventory column. This will result in two columns in the new table for the inventory numbers: the date and the inventory quantity.
Step 2 - Use the Select action to join the Products and Shipments tables, as well as calculate the cubic volume of each product.
- Select the Products_Details and Transactions_Shipment_ASD tables as input tables and name the output table Transactions_Shipment_Detail.
- Use Table Mapping to establish a table relationship between Item_Number in the Shipments table and Item_Number in the Products table.
- Right click on the link and select Matching rows to performing an inner join between the two tables. Only rows that appear in both tables will be selected.
- Select the Item_Category, Destination_ID, Ship_Qty, and Ship_Date from the Transactions_Shipment_ASD table. Select the Item_Number, Item_Descr, Sub_Dept_Descr, and Weight from the Products_Details table.
- Create the Product_CubicFeet computed field.
- Create the expression for Product_CubicFeet. The cubic volume is divided by 1,728 to convert from cubic inches to cubic feet, and the Round function is rounding the output to two decimal places:
Round{(Width x Length x Height)/1728, 2}
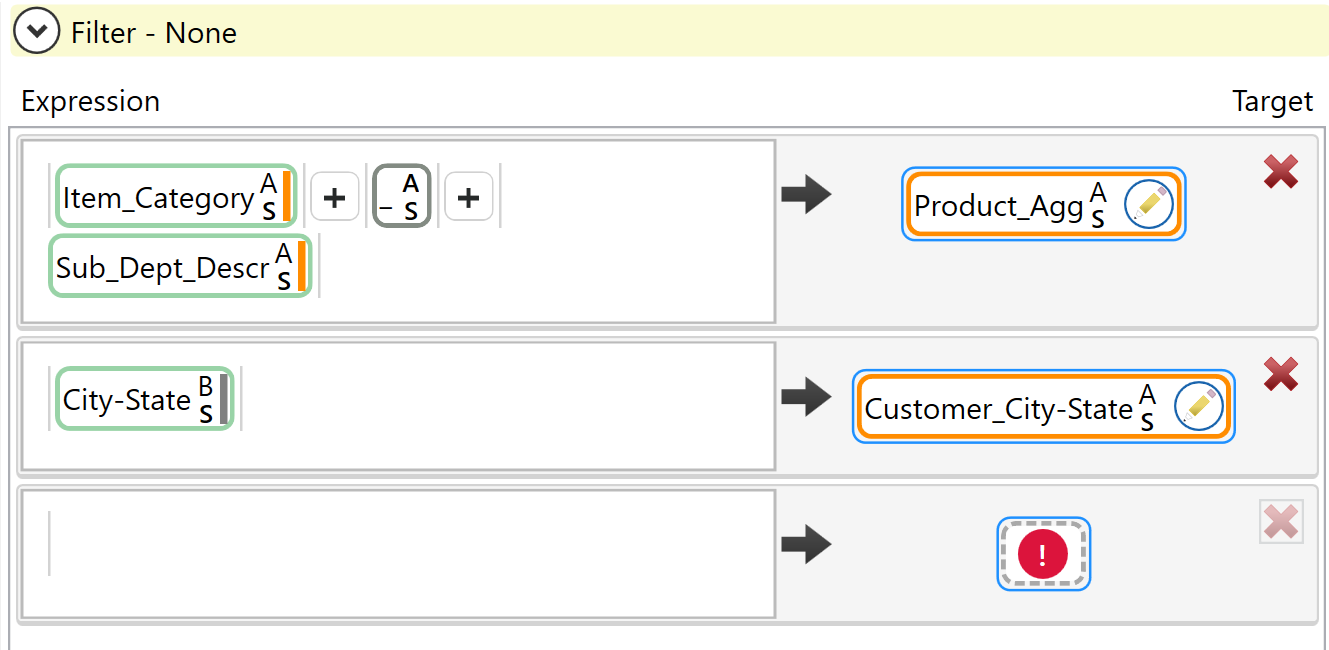
Step 3 - Use the Update action to write the new City_State column from the Sites_Customer_Detail table into the Transactions_Shipment_ASD table, as well as create a new product name to aggregate on.
- Specify Transactions_Shipment_Detail as your target table and Sites_Customer_Detail as your lookup table.
- Use Table Mapping to establish a table relationship between the Customer_ID from the Transactions_Shipment_Detail table to the Site_ID in the Sites_Customer_Detail table.
- Specify the new Product_Agg column to be created by combining the Item_Category, an underscore, and then the Sub_Dept_Descr.
- Specify the City-State column from the Sites_Customer_Detail table to be copied to the Transactions_Shipment_Detail target table in a new column called Customer_City-State.

Step 4 - Use the Aggregation action to create a customer product quarter sales shipment summary from the Transactions_Shipment_Detail table.
- Specify Transactions_Shipment_Detail as your input table and name your output table Transactions_Shipment_Summary.
- In Configuration, open the Filter section. Use the IsNotNullOrDefaultAll function to only pass records when the Product_Agg field is populated. Click the Select Fields in the function and select Product_Agg.
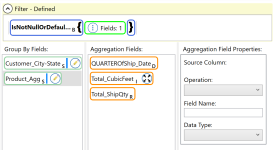
- Group the output by Customer_City-State and Product_Agg fields.
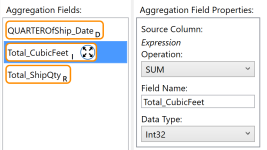
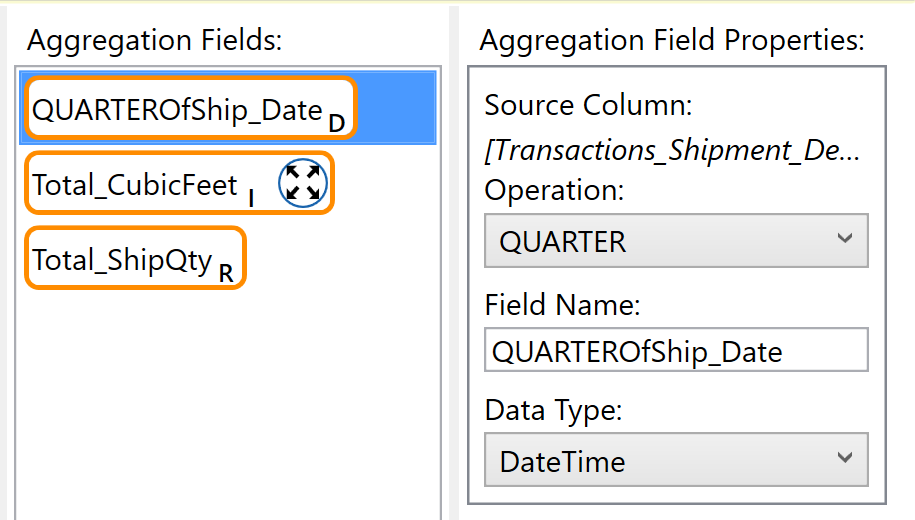
- Next, specify the aggregation fields. Specify the QUARTEROfShip_Date field to output the quarter in which the Ship Date occurred.

- Specify the Total_CubicFeet field to sum the total shipped quantity for each customer-product-quarter combination. Add an expression to multiply Ship_Qty by Product_CubicFeet so the result is the total volume shipped for each sale.
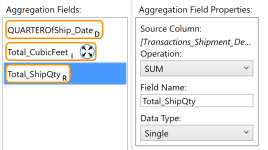
- Specify the Total_ShipQty field to sum on a computed field. The Aggregation action is now summing up the total volume of each product shipped to each customer for each quarter. When you view the output, notice that the QUARTEROfShip_Date column output is the first date of the quarter in which the shipments occurred.


Step 5 - Use the Partition Value transform to calculate the sales percentage breakdown by product for each customer. You need to do an aggregation and calculate the percentage of sum, and partition or chunk your data by customer.
- Specify Transactions_Shipment_Summary as your target table.
- Select Aggregation as your Operation, and Percent of Sum as the Function.
- Partition the output by Customer_City-State.
- Specify Total_ShipQty as the input value. This is the field you need to see as a percentage of the total sum.
-
Name the resulting new field Pct_of_City_Qty.
Last modified: Thursday December 19, 2024