Calculate total shipment volume per customer
Data Guru allows you to aggregate data using three different actions: Aggregation, Partitioned Value, and Weighted Average. This example showcases all three by calculating the total shipment volume for each customer, classifying each customer based on the shipment volume, and calculating a weighted average latitude and longitude location for each customer group.
The data in this example is made available using two delimited CSV files:
- The Customer table, which is imported as the Site_Customer table and includes -
- destination ID (field name is Destination_ID)
- latitude and longitude for each site (field names are Latitude and Longitude)
- The Transaction table, which is imported as the Transactions_SalesShipments table and includes -
- individual outbound shipments
- item description data
- source DC
- destination ID (field name is Destination_ID, which maps to the Customer Destination_ID)
- ship date
- total shipped quantity (field name is SalesQuantity)
Initial Setup:
-
Create a new Data Guru project.
-
Add two New Delimited File Connection items:
-
For the first, select the Customer.csv file that you downloaded.
-
For the second, select the Transaction.csv file.
-
For each, click Edit Mapping and ensure that the "First row contains column names" option is selected.
-
-
Create a macro, then add two Delimited File Import actions.
-
For the first, the Delimited File Connection is "Customer" and the Table Name in Output is "Site_Customer".
-
For the second, the Delimited File Connection is "Transaction" and the Table Name in Output is "Transactions_SalesShipments".
-
-
Run the actions to import the data into the new tables.
Once both tables are imported, you can manipulate the data.
Step 1 - Use the Aggregation action to create a Sales Summary for each customer that displays the total quantity of any product shipped to each customer.
- Select the Transactions_SalesShipments table as the input table.
- Specify a new table labeled Transactions_CustomerVolume for the output.
- Group the new table by Destination_ID and then by Customer_Store.
- Create a new Customer_Ship_Qty field to be aggregated.
- Set the Operation for Customer_Ship_Qty to SUM, to calculate the total shipment quantity to each customer.
Step 2 - Use the Update action to write the Customer_Ship_Qty column to the Customer table. Also create three new target columns in the Site_Customer table to store different levels of aggregation for each customer that will be assigned based on SalesQuantity.
- Select the Site_Customers table as the target table and the Transactions_CustomerVolume table as the lookup table.
- Use Table Mapping to establish table relationships between the Destination_ID in both tables, and the Customer_Store column in the Transactions_CustomerVolume table to the SiteName column in the Site_Customers table.
- Mark the mapping so only rows in the Site_Customers target table that have a match as defined in the table mapping will be updated with the values in the Transactions_CustomerVolume table. This means that any customers listed in Site_Customers that don’t appear in the Transactions_CustomerVolume table will have an empty value in the new SalesQuantity column.
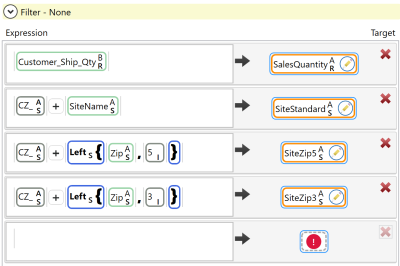
- Build the expression used to transform the data.
- Specify the Customer_Ship_Qty from the Transactions_CustomerVolume table to be copied to a new field SalesQuantity field.
- For the new SalesQuantity field, enter a Field Seed Value of 0. You must provide a seed value of zero because if a customer doesn’t appear in the Transactions table, it means there are no shipments to that customer. In other words, if the Customer_Ship_Qty is emptyin the imported Transactions_CustomerVolume table table, Data Guru will set the SalesQuantity to 0.
- Create the site group names for sorting the sites into groups in a later step. These groups will eventually be aggregated. Specify the new SiteStandard field to be created by attaching CZ_ as a prefix to the SiteName.
- Specify the new SiteZip5 field to be created by attaching CZ_ as a prefix to the left 5 characters of the Zip field.
- Specify the new SiteZip3 field to be created by attaching CZ_as a prefix to the left 3 characters of the Zip field.
- Each CZ_ field must be assigned a seed value of Inactive. Any customers that don’t appear in the Transactions_CustomerVolume table will have an empty value in the SalesQuantity column, and they will be marked inactive.

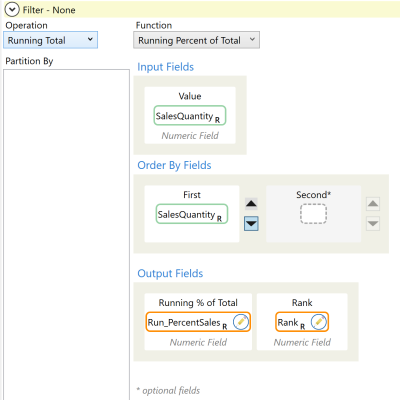
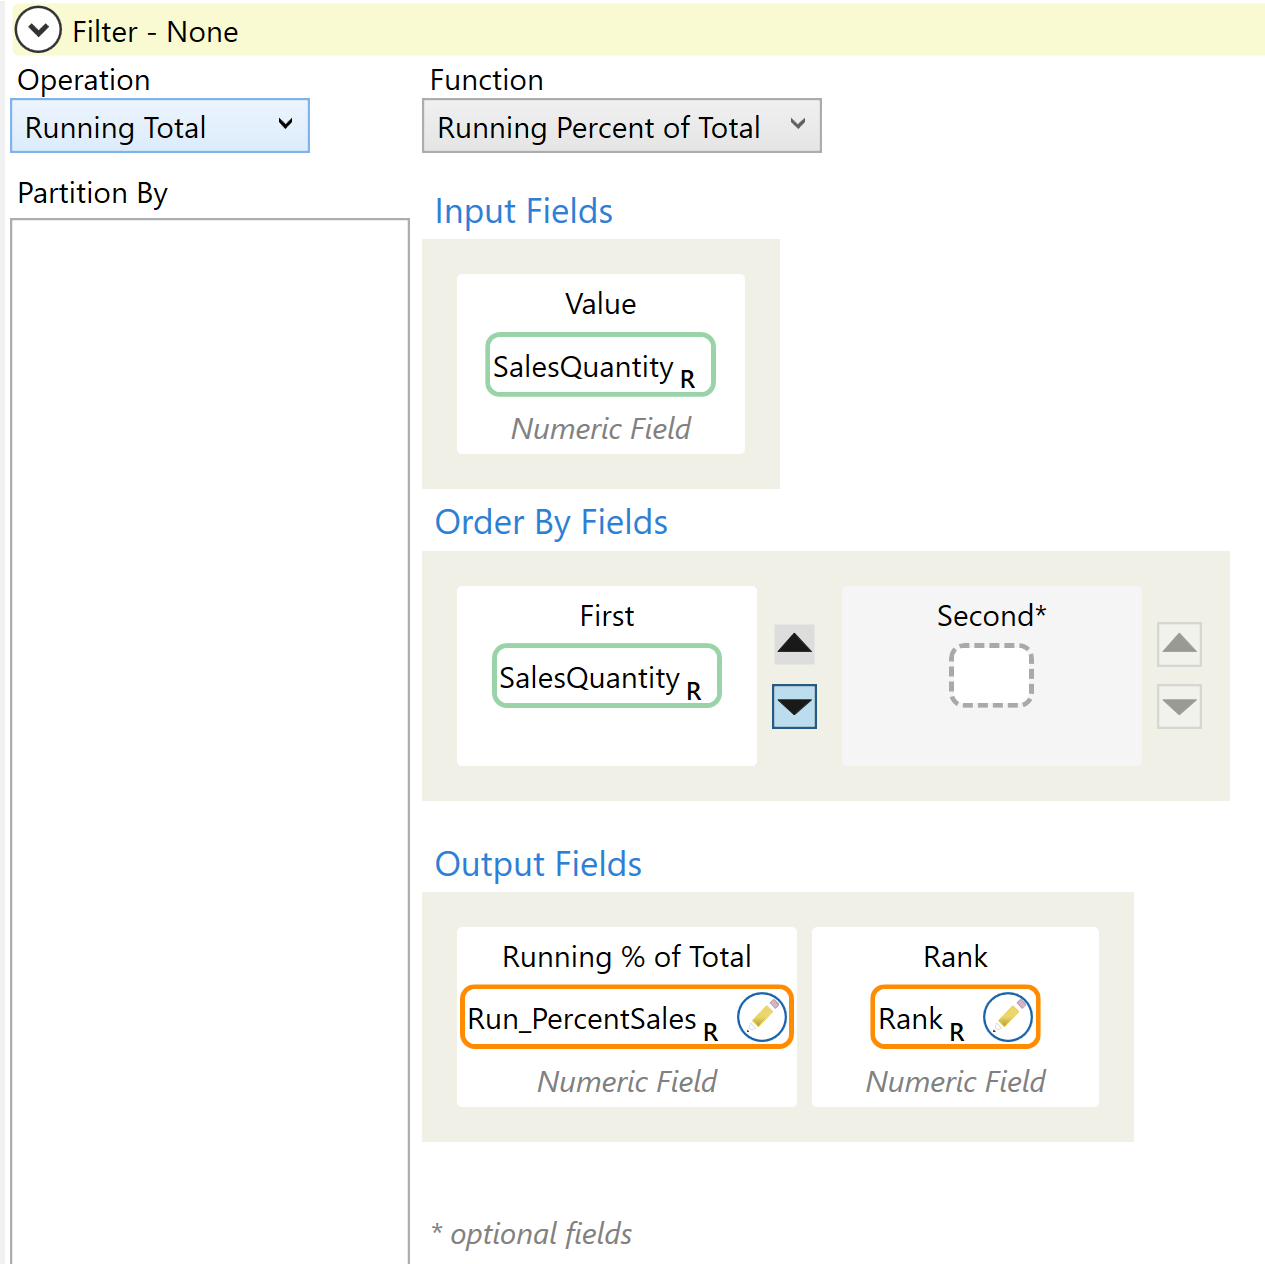
Step 3 - Use the Partitioned Value action to calculate the running sum of total sales percentage, starting with the highest volume customers.
This running percentage will be used to classify customers for aggregation by volume percentile.
- Select the Operation to be Running Total and the Function to be Running Percent of Total.
- Select SalesQuantity as the input field
- Select SalesQuantity as the output order field, with descending order.
- Specify the new output fields as Run_PercentSales and Rank. Run_PercentSales classifies customers by volume percentile for later aggregation. Rank displays the rank of customers by volume.
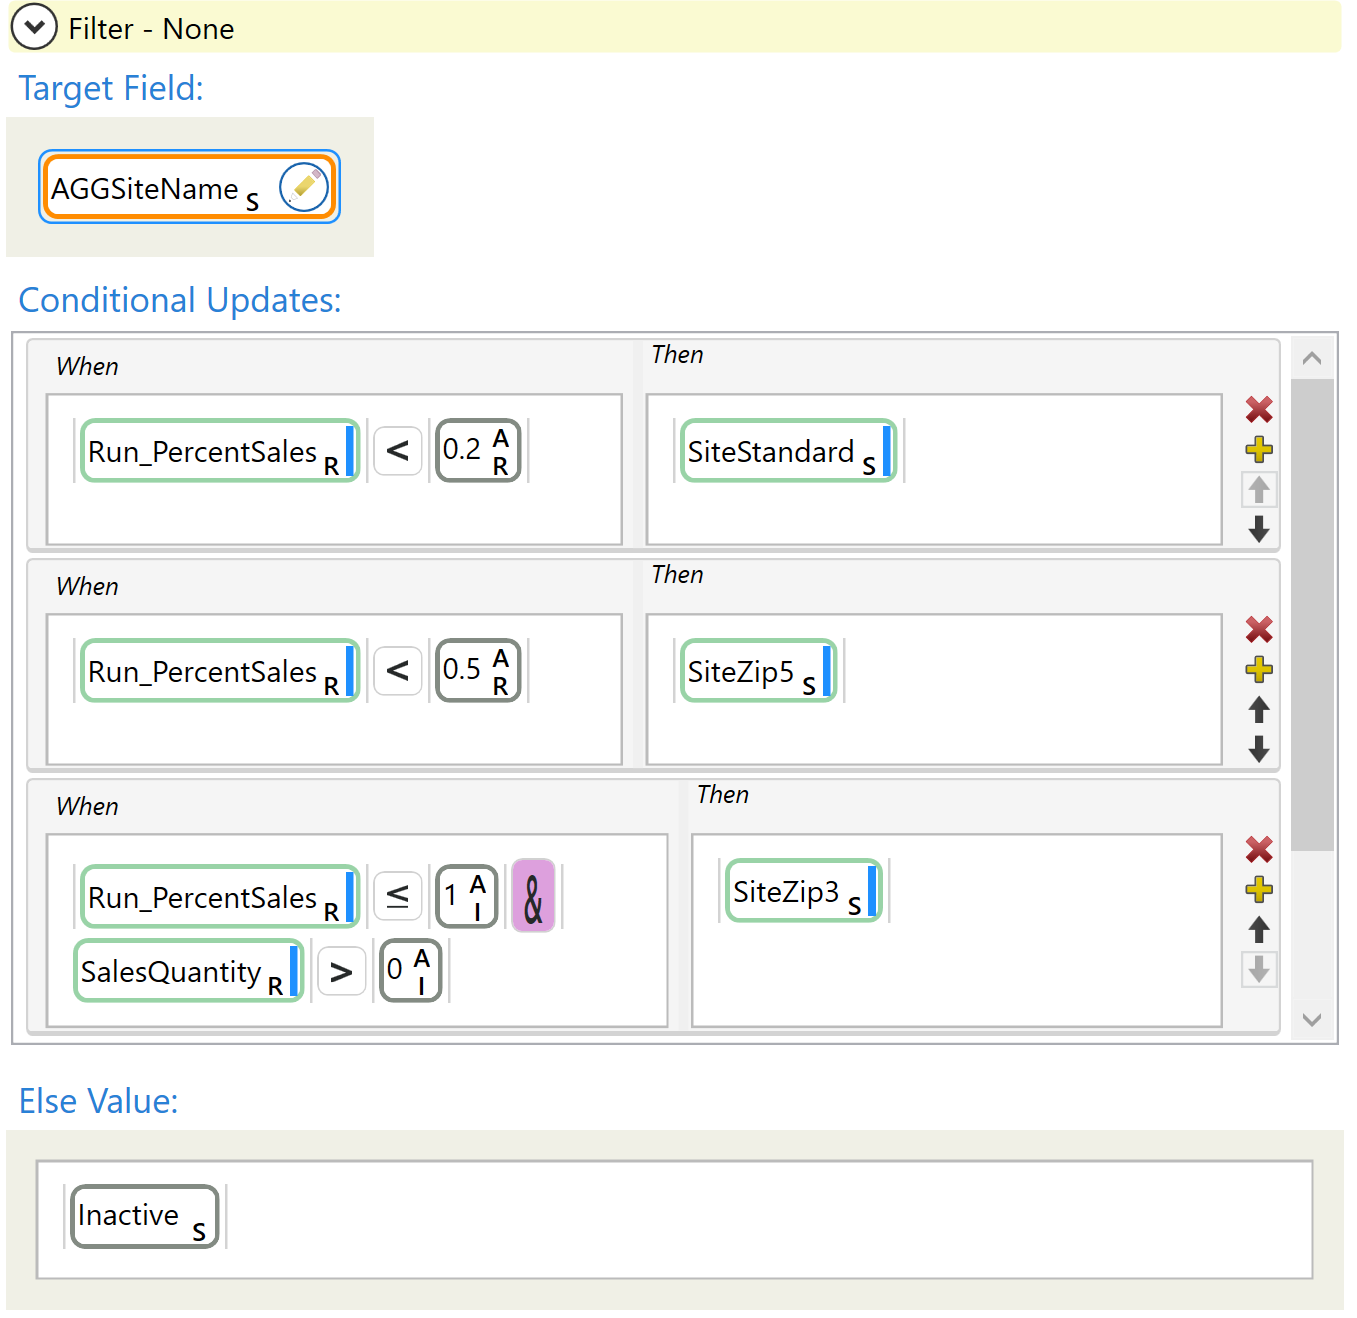
Step 4 - Use the Conditional Update action to assign each customer a new aggregated site name based on the sales volume percentile calculated by the Partitioned Value transform.
This categorizes the customers by performance, which will be used to calculate the weighted average in the next step.
- Create a new column AGGSiteName in the Customers table.
- Assign the top 20% of customers from the Run_PercentSales to the SitesStandard name (the original site name with the prefix of CZ_).
- Assign the customers in the top 50% to the SiteZip5 level.
- Assign the remaining customers that are below 50%, but have a SalesQuantity of greater than 0, to the SiteZip3 level.
- Customers with zero sales are assigned the value “Inactive”.

Step 5 - Use the Weighted Average action to calculate the weighted average of the latitude and longitude for each aggregated customer weighted by sales quantity.
- Create a new table labeled Site_AggCustomers.
- Group the new table by the AggSiteName column.
- To calculate the average of the latitude and longitude fields, place the Agg_Lattitude and Agg_Longitude fields in the Average Fields column.
- Place SalesQuantity in the Weight Field.
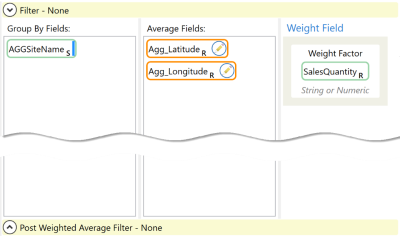

The Site_AggCustomers table now contains a weighted average latitude and longitude location for each customer group.
Last modified: Thursday December 19, 2024