Profiling data
The Data Profiling ![]() action allows you to analyze selected data columns for integrity, accuracy, and variance by reporting formatting consistency, value tendencies and averages, and conventions through an interactive grid. You can:
action allows you to analyze selected data columns for integrity, accuracy, and variance by reporting formatting consistency, value tendencies and averages, and conventions through an interactive grid. You can:
- Define the columns to profile
- Optionally enable running percentage of total calculation; execution time may be reduced when not enabled
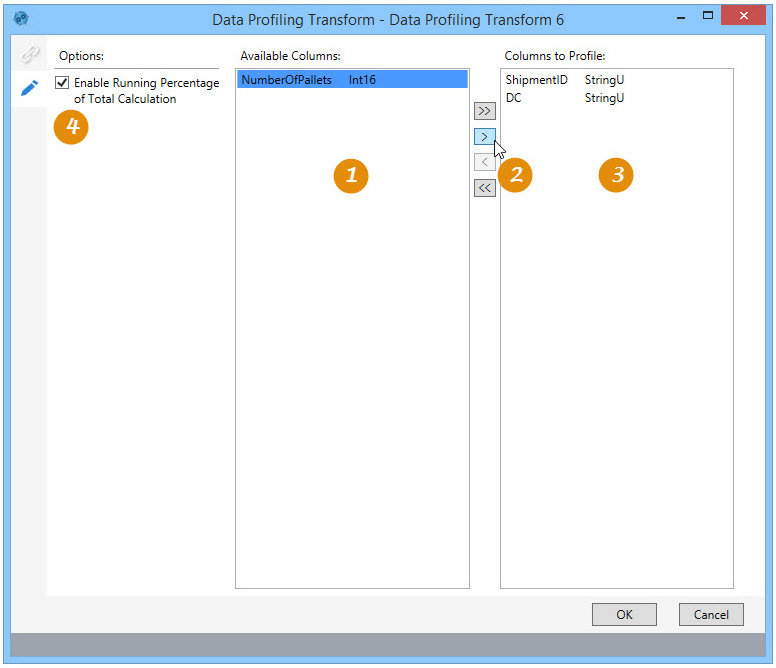
On the Configuration tab:
-
Select from the Available Columns when adding columns to use for profiling.
-
Use single arrows to drag a single selected column, or use double arrows to drag all columns.
-
Drag columns to Columns to Profile to specify those used for profiling.
-
Check Enable Running Percentage of Total Calculation to include a running percentage of total in the output.
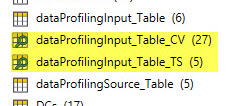
The output generated from the Data Profiling action includes a Table Statistics table (identified by a _TS suffix in the table name) and a Column Values table summarizing the data in the profiled columns (identified by a _CV suffix in the table name). The two tables are further identified by a profile icon ![]() appearing before their names.
appearing before their names.
Possible applications include:
- Identify data quality issues in a table such as Blanks and NULLs, duplicate values, and the presence of special characters, leading spaces, and trailing spaces
- Analyze patterns present in a column and review all values that have each pattern
Profile data in a table
- Drag the Data Profiling icon onto the design surface.
-
On the Connections tab
 , enter a Name and a Description to identify the action, then specify the input and output options for the profile:
Input -
- For Database Connection, select the database from which the table originates, or choose New Database Connection to establish a new connection to another database.
- For Table Name, select the table containing the data.
- For Lookup Table Name, you can optionally choose one or more lookup tables to further refine the criteria for the pass/fail tables.
Output -
- The Database Connection reflects the database to which the table is being imported.
- The Base Table Name specifies the base name for the output table names. By default, the input table name is used as the base name, but it can be overwritten. The base name is appended with _TS for the Table Statistics table and _CV for the Column Values table. If necessary, click Reset to return the base name to its default.
- The Output Mode indicates that you are creating new tables or overwriting existing tables.
- On the Configuration tab
 :
:
- Indicate columns for profiling by moving them from the Available Columns area to the Columns to Profile area.
- To move a single column, click on it, and then click on the single arrow icon pointing in the direction you want the column moved.
- To move all columns, click the double arrow icon pointing in the direction you want the columns moved.
- Under Options, indicate whether to include a running percentage of the total calculation in the output. If enabled, this choice populates the Running Percentage of Total column in the Column Values table.
Data Profiling grid
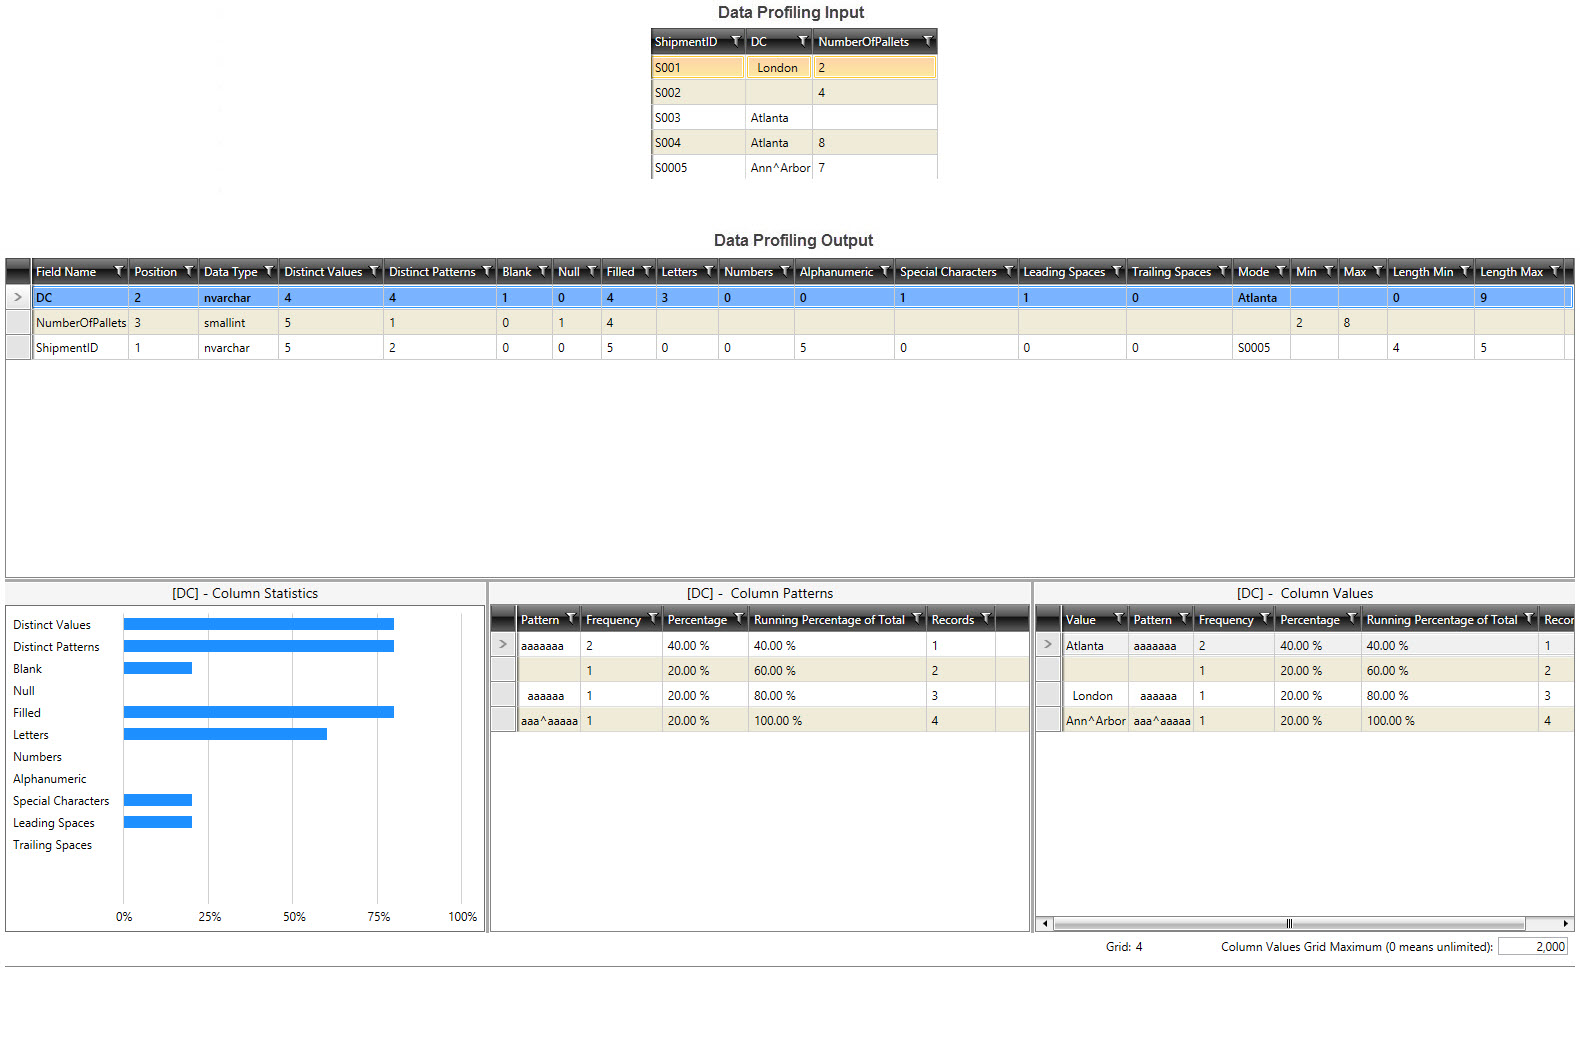
In addition to viewing the Data Profiling output tables separately, you can also view them in combination as a data profile that includes a graph with column statistics and a column pattern table, as well as a table of column values.
- To view one of the tables individually, right-click on it and select Open as Table.
- To view the files as a single profile, double-click on one of the files or right-click on one of the output tables and select Open Data Profile. The data profile grid includes a list of the profiled columns with statistics, patterns, and values for a selected column.
Once the data profile grid is open, you can click on a column pattern and display values that match that pattern.
Data Profiling data example
In this example, output from the Table Statistics and Column Values tables is viewed in the data profiling grid:
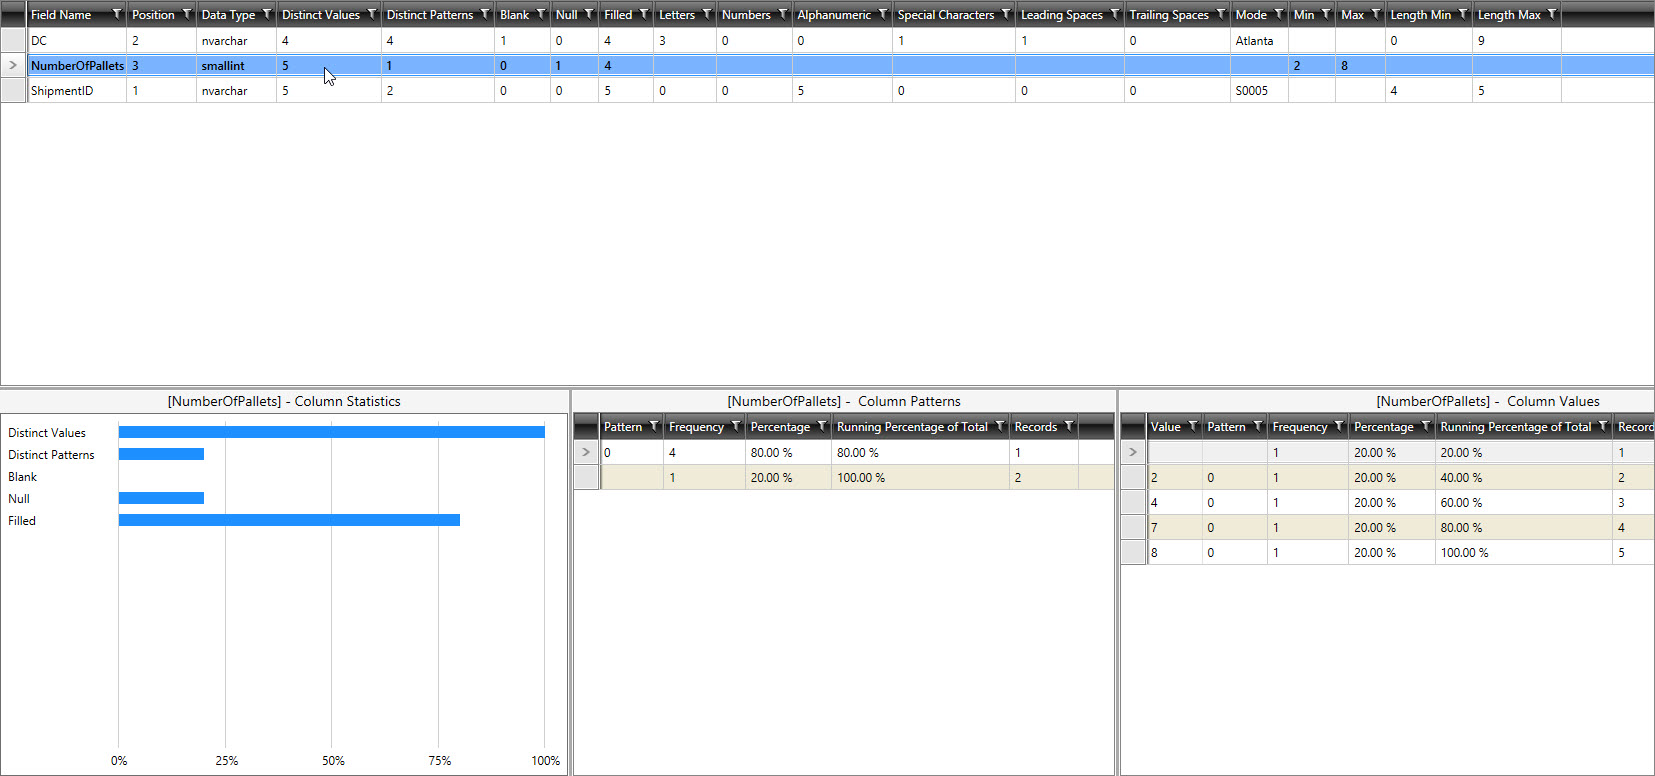
To view the statistics, patterns, and values for another column, click on the column.
Last modified: Thursday December 19, 2024