Create pivot tables
Use the Pivot Table feature to create summary views of numeric data in a grid or chart format, eliminating the need to export that data to other tools for such analysis. You can also aggregate data using the following functions:
- Sum
- Average
- Count
- Count Distinct
- Maximum
- Minimum
- Standard Deviation
- Variance
When a table that includes numerical data is displayed in Data Guru, an icon is available for switching the presentation to pivot mode.

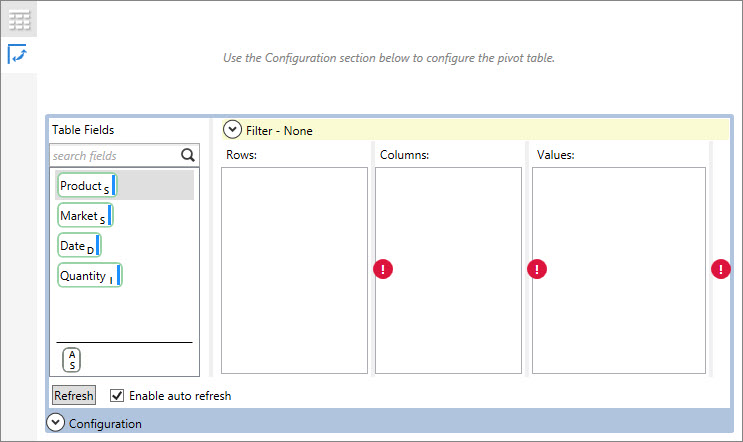
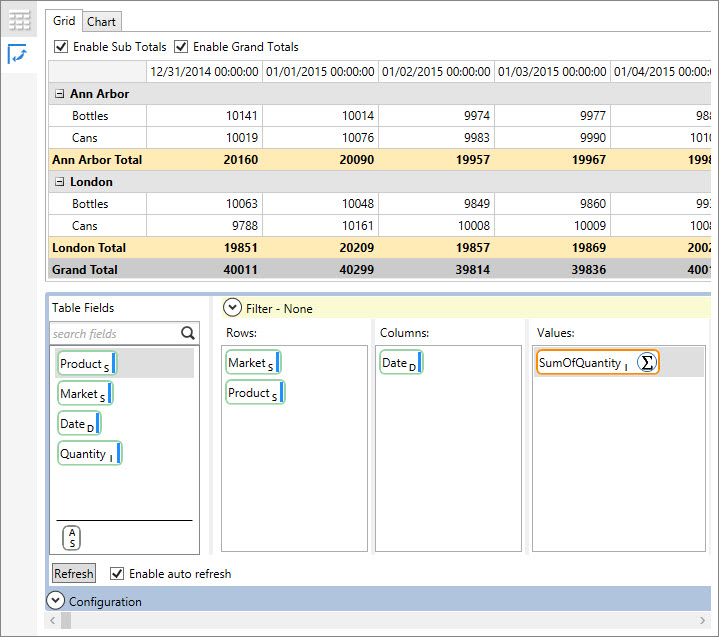
- Click the icon to display the following:
- Indicate your pivot options:
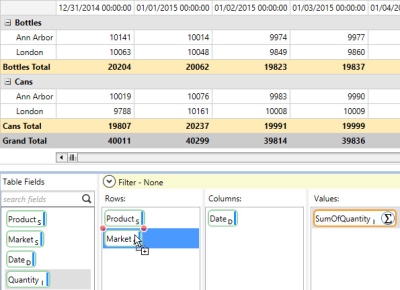
- For Rows and Columns, drag one or more icons from Table Fields to indicate the fields to be represented as rows and columns. When you include more than one field as a row or column, the order of the icons determines how the data is grouped and/or aggregated in the resulting display.
- For Values, drag the field(s) with values to be aggregated. As with Rows and Columns, if multiple fields are being aggregated, their order in the Values column determines the aggregation hierarchy.
- Select Enable Subtotals to include subtotal values for each aggregated group, and select Enable Grand Totals to include total values for each column.

- Once the table is displayed above the Configuration area, you can change your pivot options as needed:
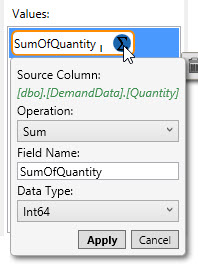
- To choose a different aggregation for the Values field, click the Function icon in the field.
- To change the data aggregation/grouping, drag the icons up or down to change their order.
- To toggle the display of the Configuration area, click the up/down arrow icon.
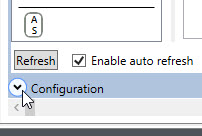
- Click Refresh at any time to redisplay the table.

Last modified: Thursday December 19, 2024